Research Article | | Peer-Reviewed

An Assessment of the Response of Land Surface Temperature to Land Use/Land Cover Change for Sustainable City

Received: 22 August 2024     Accepted: 13 September 2024     Published: 31 October 2024
Views:       Downloads:
Abstract

The influx of people from the rural settlements to urban settlements has brought about the conversion of natural surfaces to artificial impervious surfaces. These urban features directly influence the Land Surface Temperature (LST) in the Cities. In order to analyze the changes in Land Use/Land Cover (LU/LC) and its effect on LST in Abeokuta, Ogun State, Nigeria, from 1988 to 2018, this study used Geographic Information System (GIS) and Remote Sensing. In this study, Abeokuta Landsat satellite data from 1988, 1999, 2013, and 2018 were used. A Land Use/Land Cover Changes (LU/LC) analysis was conducted using ERDAS Imaging 9.2 to ascertain the areas covered by each land use type from 1988 to 2018. Landsat images were used to obtain the city's LST values from 1988 to 2018. The research findings indicate that between 1988 and 2018, built-up land use type increased while vegetative land use declined within the research area. Furthermore, the study shows that in response to changes in land use and land cover, the amount of LST increased in Abeokuta along with the increase in built-up land use. Therefore, the study suggests creation of green belts within the city in order to mitigate the impact of impervious artificial surfaces on LST. This will make the cities comfortable for its dwellers and will ensure the sustainability of the of the urban areas.

Published in International Journal of Environmental Monitoring and Analysis (Volume 12, Issue 5)
DOI 10.11648/j.ijema.20241205.13
Page(s) 125-132
Creative Commons

This is an Open Access article, distributed under the terms of the Creative Commons Attribution 4.0 International License (http://creativecommons.org/licenses/by/4.0/), which permits unrestricted use, distribution and reproduction in any medium or format, provided the original work is properly cited.

Copyright

Copyright © The Author(s), 2024. Published by Science Publishing Group

Keywords

Land Use/Land Cover Change, Land Surface Temperature, Sustainable City

1. Introduction
One of the primary causes of climate change has been attributed to urbanization . Significant changes in land use and land cover dynamics have occurred due to the constant influx of people from rural to urban areas in the State Capital cities of South-Western Nigeria during the last few decades . Vegetation, agriculture, and water bodies have significantly decreased as a result of the built-up areas that have grown significantly to accommodate the city's ever-increasing population. Urbanization-related changes in land use and cover have had an asymmetrical effect on climate through altered interactions between the atmosphere and the earth's surface. Variations in climatic parameters, such temperature and humidity, can lead to distinct climatic conditions and the emergence of heat islands . The micro-climate of cities can be changed by replacing natural features like soil, water bodies, and vegetation with paved surfaces and buildings. In Abeokuta, Ogun State, Nigeria, changes to the land cover and loss of green space can raise the temperature of the land surface. The micro-climate of cities can be changed by replacing natural features like soil, water bodies, and vegetation with paved surfaces and buildings. In Abeokuta, Ogun State, Nigeria, changes to the land cover and loss of green space can raise the temperature of the land surface . This makes it possible to analyze how the land surface temperature responds to the expansion of settlements. It is a well-known fact that changes in land cover and use can have significant consequences on the local climate and weather. An obvious impact of the alterations is a rise in temperature, which is a clear indicator of environmental deterioration . Olofin, E. O. and Adebayo, W.O. revealed that there may be significant strain on forest areas due to the expansion of settlement driven an increase in population in Gbonyin Local Government Area in Ekiti State, South West Nigeria. In order to make room for the manufacturing of plywood and tissue paper, forest areas were destroyed. For the location of these manufacturing businesses, countless hectares of forest were cut. For residential purposes, forest areas were also removed. The land surface temperature in Abeokuta, Ogun State, Nigeria, may rise as a result of all these processes conversion of vegetated land use to built-up land use. Greenery offers social, economic, and ecological advantages and is a useful indicator of the condition and quality of our surroundings. In addition to cleaning the air we breathe and the water we drink, their leaves and roots inspire writers and artists . More vegetation results in increased production of ecosystem services, such as improved air and water quality, reduced storm and water runoff, atmospheric carbon storage and sequestration, and lowered land surface temperature .
Sustainable cities are built on systems that produce co-benefits such as equitable social development, inclusive economic growth, and a secure and comfortable environment . We have to create sustainable cities if we are to preserve the urban environment in a way that will enable future generations to meet their requirements in all circumstances.
The usual price of an increased standard of living in cities is the depletion of natural resources and the destruction of landscapes . Making cities and their ecosystems healthy and long-lasting in terms of their economic, social, and environmental components is the main objective of sustainable city development. The idea of a sustainable city develops out of this perspective . A sustainable city is one that builds on its natural, social, and economic capital in ways that support the well-being, productivity, and happiness of both its present and future inhabitants . A city planned with the environment in consideration, populated by individuals committed to reducing heat and creating a healthy city for the future.
2. Material and Methods
Study area
Abeokuta, the Capital City of Ogun State, South Western Nigeria, consists of 28 main streets with an urban features (Figure 1). The City have two local government areas which include, Abeokuta North and Abeokuta South and covers an approximate area of 781.16 km2.
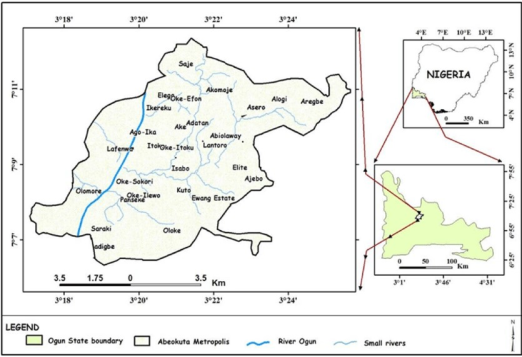
Figure 1. THE ADMINISTRAVE MAP OF THE STUDY AREA.
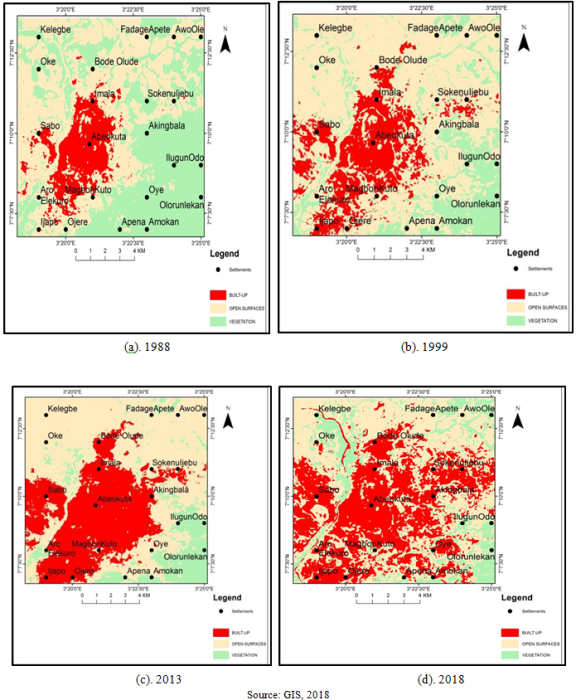
Since its founding in 1830, Abeokuta has steadily expanded. Owing to the British Government, Abeokuta became the headquarters of the Egba United Government in 1839 . Since Ogun State was created in 1976, Abeokuta has experienced tremendous growth, including an upsurge in the construction of residential and commercial buildings as well as new roads. This growth led to a rise in the transformation of natural landscapes into landscapes that are artificial.
The Necessary Data and its Sources
The land surface temperature and land use/cover of Abeokuta, Ogun State, Nigeria, from 1988 to 2018 were the attributes that this study carefully examined. Remotely sensed Imageries of the research area in 1988, 1999, 2013, and 2018 served as the primary data source for land surface temperature and land use/cover. The sites of the National Center for Earth Resources Observation and Science (EROS) and the U.S. Geological Survey (USGS) provided all of these Landsat Imageries (Table 1). An investigation was conducted on the LST and LU/LC in Abeokuta within a thirty-year duration, from 1988 to 1999, 1999 to 2013, and 2013 to 2018, respectively.
Table 1. An Explanation of the Satellite Imageries Used in the Study.

Acquisition Date

Source

Path/Role

Resolution

Landsat Series

04 Dec. 1988

USGS

190/55

30M.

L5

17 Dec. 1988

USGS

191/55

30M.

L5

21 Jan. 1999

USGS

190/55

30M.

L5

18 Dec. 1999

USGS

191/55

30M.

L5

14 Dec. 2013

USGS

190/55

30M.

L7

27 Dec. 2013

USGS

191/55

30M.

L7

16 Jan. 2018

USGS

190/55

30M.

L8

03 Jan. 2018

USGS

191/55

30M.

L8

Source: USGS, 2018
Methods
From the Landsat imagery of the study area, three types of land use which include, vegetated, open surfaces, and built-up land uses were selected in order to investigate changes in land use and land cover in the study area. (Table 2). The land surface temperature values in the study area were investigated using the geographic link of ERDAS Imaging 9.2 between 1988 and 2018. To determine the rate at which land use/land cover are changing and how land surface temperature in the study area is responding, the percentage changes in the sizes of each class of land use and the related land surface temperature values were collated and tabulated from 1988 to 2018.
Table 2. A clarification of the land use/land cover.

Land Use Types

Description

Built-Up

Residential, Commercial, Roads and other Urban Features

Vegetation

Forest, Cash Crops and Urban Green Belts

Open Surfaces

Exposed Soil and Rock surfaces

Source: Researcher’s Field Work, 2018
Changes in land use and land cover were detected using a change detection technology called image differencing. One of the most common techniques for detecting changes is image differencing, which works by subtracting images that were acquired at separate dates. The process is taking a band's Digital Number (DN) value for one date and subtracting it from the band's DN value for another date . A change detection approach was used to assess the changes in Abeokuta's land cover and use between 1988 and 2018.
3. Results and Discussion
Land Use Change Investigation in Abeokuta
Built-up areas, which include all impermeable surfaces like concrete land cover, asphalt roads, residential and commercial buildings, and other urban features, are referred to in this study as city; vegetation, on the other hand, includes dense forests, tree croplands, urban green belts, and exposed soil and rock surfaces depicted as open surfaces.
Land Use Types and Area Coverage in Abeokuta from 1988 to 2018
Table 3 shows the areas that each land use type in Abeokuta covered from 1988 to 2018. Also, Landsat maps were produced and presented in Figures 2a, 2b, 2c, and 2d, respectively, to show the built-up, open surfaces, and vegetated land uses in Abeokuta.
Table 3. Areas Covered by each land use types from 1988 to 2018 in Abeokuta.

Land Uses

Areas in 1988 (km2)

Areas in 1999 (km2)

Areas in 2013 (km2)

Areas in 2018 (km2)

Built-Up

18.13

30.36

58.03

71.11

Open Surfaces

136.55

148.96

132.68

116.86

Vegetation

98.16

76.37

67.49

67.78

Total

252.84

255.69

258.20

305.75

Source: Derived from 1988, 1999, 2013, and 2018 Landsat images
Figure 2. Images from Landsat spanning 1988, 1999, 2013, and 2018 depicting the area in Abeokuta covered by different land use. Images from Landsat spanning 1988, 1999, 2013, and 2018 depicting the area in Abeokuta covered by different land use.
Figure 2 shows the land cover and land use maps of Abeokuta for the years 1988, 1999, 2013, and 2018. Table 3 shows the calculated total land use area of vegetation, open surfaces, and built-up land use types from 1988 to 2018. The built-up land use type in Abeokuta covered a total area of 18.13 km2 in 1988, 30.36 km2 in 1999, 58.03 km2 in 2013, and 71.11 km2 in 2018, over the course of the 30 years under investigation. A total of 136.55 km2 was covered by the land use type of open surfaces in 1988, 148.96 km2 in 1999, 132.68 km2 in 2013, and 116.86 km2 in 2018. The area covered by the vegetation land use type was 98.16 km³ in 1988, 76.37 km2 in 1999, 67.49 km2 in 2013, and 67.78 km2 in 2018 respectively. The built-up land use type increased significantly from 18.13 km2 in 1988 to 30.36 km2 in 1999, from 30.36 km2 in 1999 to 58.03 km2 in 2013, and from 58.03 km2 in 2013 to 71.11 km2 in 2018, as shown in Table 3. The built-up land use type has increased by 52.98 km2 over the last 30 years, as evidenced in Table 3, indicating an increase from 18.13 km2 in 1988 to 71.11 km2 in 2018. The indiscriminate destruction of forest due to population growth may be the contributing factor to the increase in the built-up land use type. From 136.55 km2 in 1988 to 148.96 km2 in 1999, open surfaces experienced a significant growth, indicating a 12.41 km2 decadal increase. The conversion of tropical forests to farmlands is one of the factors contributing to this significant increase. However, from 148.96 km2 in 1999 to 132.68 km2 in 2013, and from 132.68 km2 in 2013 to 116.86 km2 in 2018, the open surfaces land use type decreased. The construction of urban features including roadways, residential structures, and commercial buildings on open spaces that were previously utilized for agriculture as a result of population growth in Abeokuta may be the causes of this decline. The area used for vegetation land use type decreased significantly between 1988 and 2018, from 98.16 km2 to 67.78 km2, indicating a reduction of 30.38 km2.
Abeokuta: Land Surface Temperature Dynamics
Table 4 shows the Land Surface Temperature values for Abeokuta from 1988 to 2018. Figures 3a, 3b, 3c, and 3d show the land surface temperature maps of Abeokuta from 1988 to 2018.
Table 4. LST Obtained for Different Years in Abeokuta.

Years

1988

1999

2013

2018

LST (°C)

24.2

25.6

27.5

29.0

Source: Derived from 1988, 1999, 2013, and 2018 Landsat images
Table 4 shows that the LST value increased significantly between 1988 and 2018, increasing from 24.2°C to 29.0°C It appears that changes in land use and land cover in the study area are the main cause of the LST value's increase from 24.2°C to 29.0°C. In other words, the increase in LST value is in response to the study area's conversion from vegetative land use and land cover to built-up land use and land cover, thus paving way for road networks and residential and commercial structures. (Table 4 and Figure 2).
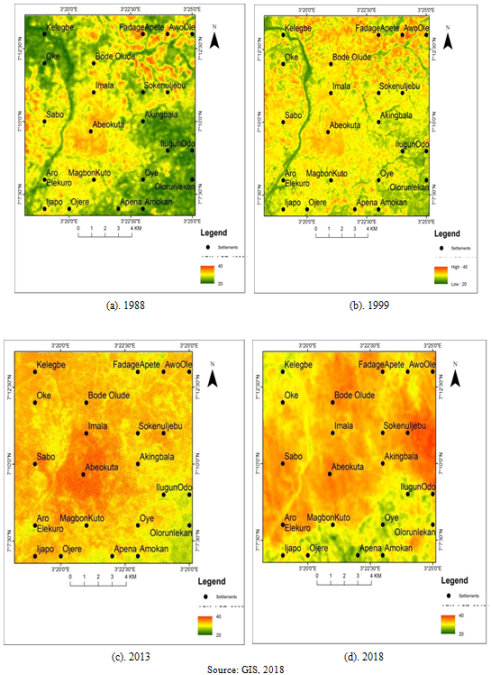
Figure 3. Dynamics of Land Surface Temperature in Abeokuta, 1988 to 2018.
The built-up areas in Figure 3 are indicated by red areas with high land surface temperatures, while the vegetated areas are indicated by green areas with low land surface temperatures.
Table 5. The percentage of Built-Up Land Use Changes and the Corresponding LST Values in Abeokuta.

City

Years

% of Changes in Built-up Land use

% of Changes in LST

Abeokuta

1988-1999

67.46

5.8

1999-2013

91.14

7.1

2013-2018

22.78

5.5

1988-2018

74.50

16.3

Source: Derived from 1988, 1999, 2013, and 2018 Landsat images
From 1988 to 1999, Abeokuta's built-up land use increased by 67.46%, with a 5.8% LST. From 1999 to 2013, built-up land use increased by 91.14%, with a 7.1% LST. From 2013 to 2018, built-up land use increased by 22.54%, with a 5.5% LST. In Abeokuta, the percentage of built-up land use increased from 1988 to 2018 by 74.50%, while the percentage of LST increase was 16.3%. The land surface temperature may increase considerably when vegetated land cover is converted to impermeable surfaces.
4. Conclusion
The areas covered by the vegetation land use type in Abeokuta, Ogun State, Nigeria, has predominantly decreased as a result of conversion to open surfaces and built-up land use types. The conversion of the vegetated regions into open spaces and built-up land uses in this city may have been caused by the population growth there. The decrease in the study area's vegetated areas has led to a significant increase in Abeokuta's land surface temperature (Table 5). On the other hand, adopting the concept of Green Urbanism (GU) and creating Green Belts (GB) within the city will contribute to the sustainability of our cities by reducing the Land Surface Temperature (LST) within the cities.
Transpiration and the emission of water vapor are two ways that vegetation uses solar radiation to lower air temperature and perhaps land surface temperature . Note that, the cooling effects on the ground surface increase with the amount of vegetation present. Apart from the evaporative cooling properties of vegetation, trees' shadow can also operate as a coolant by blocking solar radiation and halting an increase in land surface temperature . The increase in Land Surface Temperature observed in Abeokuta, Ogun State, Nigeria, can be attributed to the decrease in the city's vegetated areas. It was believed that the increase in LST in the study area was a result of an increase in the type of built-up land use, based on the findings of this study. This conclusion highlights the necessity for targeted policies aimed at creating sustainable cities, such as the creation of urban green spaces inside cities and the state government's adoption of the green urbanism concept.
Abbreviations

DN

Digital Number

ERDAS

Earth Resources Data Analysis System

EROS

Earth Resources Observation and Science

GB

Green Belts

GIS

Geographic Information System

LST

Land Surface Temperature

LU/LC

Land Use/Land Cover

USGS

United States Geological Survey

Author Contributions
Emmanuel Oluwafemi Olofin is the sole author. The author read and approved the final manuscript.
Conflicts of Interest
The author declares no conflict of interest.
References
[1] Adebayo, W. O. (1997). Heat Island and Oasis Effect of Vegetative Canopies: A Micro- meteorological Investigation. International Journal of Urban and Regional Affairs. 1(1): 35-39.
[2] Adebayo, W. O. and Olofin, E. O. (2016) A Comparative Analysis of Impacts of Settlements on Temperature between Urban and Rural Areas of Ekiti State. A Paper Presented at the 3rd EKSU International Conference and Research Fair.
[3] Adebayo, W. O. and Owolabi, J. T. (2004). Microclimate Relationships of Open Space and Vegetative Canopy in an urban Environment. Journal of the Social Sciences. 3(1): 41-47.
[4] Adenekan, A. (2000). The National Ggagura. Abeokuta. Ambassador for Christ Publisher’s Incorporation. 6-7.
[5] Asmiwyati, A. R. (2016) Impact of Land Use Change on Urban Surface Temperature and Urban Green Space Planning; Case Study of the Island of Bali, Indonesia. A Ph.D. Thesis Presented for the Degree of Doctor of Philosophy of Curtin University. 27-28.
[6] Fabrizi, R. (2010). Satellite and Ground Based Sensors for the Urban Heat Island Analysis in the City of Rome. Journal of Remote Sensing. 57(2): 1400-1410.
[7] Hart, M. (1999). Guide to Sustainable Community Indicators: Second Edition. Hart Environmental Data, North Andover, MA Publisher. 23-25.
[8] Jacob, R. J. (2015). Effects of Urban Growth on Temporal Variation of Surface Temperature in Katsina Metropolis, Nigeria. An M. Sc. Thesis Submitted to the School of Postgraduate Studies, Ahmadu Bello University, Zaira. 16-26.
[9] Mc Carthy, M. P. (2010). Climate change cities due to Global warming and Urban Effect. Journal of Geophysics. 37(8): 28-34.
[10] Oke, T. R. (1989). The micro-meteorology of the urban forest. Philosophical Transactions of the Royal Society B: Biological Sciences, 324(1223), 335-349.
[11] Olofin, E. O. and Adebayo, W. O. (2017). Effects of Deforestation on Land Degradation. Saarbrucken, Germany. LAMBERT Academic Publishing, 63.
[12] Singh, A. (1989). Digital Change: Detection Techniques using Remotely Sensed Data. International Journal of Remote Sensing. 10(6): 9989-1003.
[13] Smith, R. M. (2015). Planning for Urban Sustainability. International Journal of Urban Sustainable Development. 2(7). 15-22.
[14] Turner, V. K. (2015). Do sustainable urban Designs Generate more Ecosystem services. A Case Study of Civemo in Tueson, Arizona. Journal of Environmental Sustainability. 67(6): 204-217.
[15] UN–HABITAT (2012). Cities and Climate Change: Global Report on Human Settlements, 2011 United Nations Human Settlements program.
Cite This Article
  • APA Style

    Olofin, E. O. (2024). An Assessment of the Response of Land Surface Temperature to Land Use/Land Cover Change for Sustainable City. International Journal of Environmental Monitoring and Analysis, 12(5), 125-132. https://doi.org/10.11648/j.ijema.20241205.13

    Copy | Download

    ACS Style

    Olofin, E. O. An Assessment of the Response of Land Surface Temperature to Land Use/Land Cover Change for Sustainable City. Int. J. Environ. Monit. Anal. 2024, 12(5), 125-132. doi: 10.11648/j.ijema.20241205.13

    Copy | Download

    AMA Style

    Olofin EO. An Assessment of the Response of Land Surface Temperature to Land Use/Land Cover Change for Sustainable City. Int J Environ Monit Anal. 2024;12(5):125-132. doi: 10.11648/j.ijema.20241205.13

    Copy | Download

  • @article{10.11648/j.ijema.20241205.13,
      author = {Emmanuel Oluwafemi Olofin},
      title = {An Assessment of the Response of Land Surface Temperature to Land Use/Land Cover Change for Sustainable City
    },
      journal = {International Journal of Environmental Monitoring and Analysis},
      volume = {12},
      number = {5},
      pages = {125-132},
      doi = {10.11648/j.ijema.20241205.13},
      url = {https://doi.org/10.11648/j.ijema.20241205.13},
      eprint = {https://article.sciencepublishinggroup.com/pdf/10.11648.j.ijema.20241205.13},
      abstract = {The influx of people from the rural settlements to urban settlements has brought about the conversion of natural surfaces to artificial impervious surfaces. These urban features directly influence the Land Surface Temperature (LST) in the Cities. In order to analyze the changes in Land Use/Land Cover (LU/LC) and its effect on LST in Abeokuta, Ogun State, Nigeria, from 1988 to 2018, this study used Geographic Information System (GIS) and Remote Sensing. In this study, Abeokuta Landsat satellite data from 1988, 1999, 2013, and 2018 were used. A Land Use/Land Cover Changes (LU/LC) analysis was conducted using ERDAS Imaging 9.2 to ascertain the areas covered by each land use type from 1988 to 2018. Landsat images were used to obtain the city's LST values from 1988 to 2018. The research findings indicate that between 1988 and 2018, built-up land use type increased while vegetative land use declined within the research area. Furthermore, the study shows that in response to changes in land use and land cover, the amount of LST increased in Abeokuta along with the increase in built-up land use. Therefore, the study suggests creation of green belts within the city in order to mitigate the impact of impervious artificial surfaces on LST. This will make the cities comfortable for its dwellers and will ensure the sustainability of the of the urban areas.
    },
     year = {2024}
    }
    

    Copy | Download

  • TY  - JOUR
    T1  - An Assessment of the Response of Land Surface Temperature to Land Use/Land Cover Change for Sustainable City
    
    AU  - Emmanuel Oluwafemi Olofin
    Y1  - 2024/10/31
    PY  - 2024
    N1  - https://doi.org/10.11648/j.ijema.20241205.13
    DO  - 10.11648/j.ijema.20241205.13
    T2  - International Journal of Environmental Monitoring and Analysis
    JF  - International Journal of Environmental Monitoring and Analysis
    JO  - International Journal of Environmental Monitoring and Analysis
    SP  - 125
    EP  - 132
    PB  - Science Publishing Group
    SN  - 2328-7667
    UR  - https://doi.org/10.11648/j.ijema.20241205.13
    AB  - The influx of people from the rural settlements to urban settlements has brought about the conversion of natural surfaces to artificial impervious surfaces. These urban features directly influence the Land Surface Temperature (LST) in the Cities. In order to analyze the changes in Land Use/Land Cover (LU/LC) and its effect on LST in Abeokuta, Ogun State, Nigeria, from 1988 to 2018, this study used Geographic Information System (GIS) and Remote Sensing. In this study, Abeokuta Landsat satellite data from 1988, 1999, 2013, and 2018 were used. A Land Use/Land Cover Changes (LU/LC) analysis was conducted using ERDAS Imaging 9.2 to ascertain the areas covered by each land use type from 1988 to 2018. Landsat images were used to obtain the city's LST values from 1988 to 2018. The research findings indicate that between 1988 and 2018, built-up land use type increased while vegetative land use declined within the research area. Furthermore, the study shows that in response to changes in land use and land cover, the amount of LST increased in Abeokuta along with the increase in built-up land use. Therefore, the study suggests creation of green belts within the city in order to mitigate the impact of impervious artificial surfaces on LST. This will make the cities comfortable for its dwellers and will ensure the sustainability of the of the urban areas.
    
    VL  - 12
    IS  - 5
    ER  - 

    Copy | Download

Author Information