Abstract
The northern coast of Senegal, located on the western edge of the Sahel, is characterized by high climate variability, the repercussions of which directly affect the region's socio-economic activities, particularly market gardening in the Niayes area. This study aims to analyze the variability of rainfall and temperatures at the Thies, Louga, and Saint-Louis weather stations over the period 1994-2024, through the study of temporal trends, interannual anomalies, and breaks in the climate series. The data, provided by the National Civil Aviation and Meteorology Agency (ANACIM), were processed using the Mann-Kendall test, the Sen slope test, and the Pettitt test. The results reveal a rainfall gradient decreasing from south to north, with average rainfall decreasing from 474.3 mm in Thies to 289.0 mm in Saint-Louis, and a reverse temperature gradient, with the Louga station recording the highest temperatures. Trend analysis reveals a significant increase in rainfall and temperatures in Louga, a significant but more limited warming in Thies (minimum and average temperatures), and the absence of a significant trend in Saint-Louis. The Pettitt test reveals primarily thermal breaks, concentrated between 2009 and 2016 in Louga and Thies, with no break detected in Saint-Louis. These results reflect a marked spatial differentiation of climate change along the northern Senegalese coast, likely linked to the moderating effect of the Atlantic Ocean, and underscore the need for continuous climate monitoring to anticipate impacts on water resources and agricultural activities in the region.
Keywords
Climate Variability, Precipitation, Temperatures, Trends, Climate Breaks, Northern Coast of Senegal, Niayes
1. Introduction
Over recent decades, the Sahel has experienced a marked recurrence of droughts, leading to a significant decline in the water resources upon which the region's main socio-economic activities heavily depend
| [1] | Sultan, B., Baron, C., Dingkuhn, M., Sarr, B., & Janicot, S. (2005). “Climate variability in West Africa at seasonal scales: Applications to the sensitivity of agricultural yields in the Sahel”. Drought, 16, 23-33. |
| [2] | Gachon, P., Gauthier, N., Bokoye, A., Parishkura, D., Cotnoir, A., Tremblay, Y., & Vigeant, G. (2007). Working Group II: Variability, extremes and climate change in the Sahel: from observation to modelling, in Report of Canadian contributions to the CIDA-CILSS project: Supporting adaptation capacities to climate change. Environment Canada, A030978-002. |
[1, 2]
. In West Africa, this climatic dynamic was particularly evident during the severe drought of the 1970s
| [3] | Nicholson, S. E. (1980). “The nature of rainfall fluctuations in subtropical West Africa”. Monthly Weather Review, 108(4), 473-487.
https://doi.org/10.1175/1520-0493(1980)108<0473:TNORFI>2.0.CO;2 |
| [4] | Held, I. M., Delworth, T. L., Lu, J., Findell, K. U., & Knutson, T. R. (2005). “Simulation of Sahel drought in the 20th and 21st centuries”. Proceedings of the National Academy of Sciences, 102(50), 17891-17896.
https://doi.org/10.1073/pnas.0509057102 |
[3, 4]
; the consequences of this drought for agriculture the population's primary activity contributed significantly to slowing the region's socio-economic development. Since the 2000s, the Sahel appears to be experiencing a relative recovery in rainfall, although the long-term persistence of this trend in the coming decades remains uncertain
. This period also coincides with global warming attributed to rising greenhouse gas (GHG) emissions, making it essential to analyze changes in water withdrawal patterns
| [28] | IPCC (2022). “Africa”. In: Climate Change 2022: Impacts, Adaptation and Vulnerability. Contribution of Working Group II to the Sixth Assessment Report of the Intergovernmental Panel on Climate Change. Cambridge University Press, Cambridge, UK, pp. 1285-1456.
https://doi.org/10.1017/9781009325844.011 |
| [29] | Chawanda, C. J., Nkwasa, A., Thiery, W., & van Griensven, A. (2024). “Combined impacts of climate and land-use change on future water resources in Africa”. Hydrology and Earth System Sciences, 28(1), 117-138.
https://doi.org/10.5194/hess-28-117-2024 |
[28, 29]
. According to several studies, these droughts are driven by various factors, notably land-use changes and deforestation
| [6] | Xue, Y., & Shukla, J. (1993). “The influence of land surface properties on Sahel climate. Part I: Desertification”. Journal of Climate, 6, 2232-2245.
https://doi.org/10.1175/1520-0442(1993)006<2232:TIOLSP>2.0.CO;2 |
| [7] | Zheng, X., & Eltahir, E. A. B. (1998). “The role of vegetation in dynamics of West African Monsoon”. Journal of Climate, 11, 2078-2096.
https://doi.org/10.1175/1520-0442(1998)011<2078:TROVIT>2.0.CO;2 |
[6, 7]
, as well as sea-surface temperature variability in the Atlantic (North and South) and Pacific Oceans, through teleconnections linked notably to the El Niño phenomenon
| [8] | Rowell, D. P. (2003). “The Impact of Mediterranean SSTs on the Sahelian rainfall season”. Journal of Climate, 16, 849-862.
https://doi.org/10.1175/1520-0442(2003)016<0849:TIOMSO>2.0.CO;2 |
| [9] | Messager, C., Gallée, H., & Brasseur, O. (2004). “Precipitation sensitivity to regional SST in a regional climate simulation during the West African monsoon for two dry years”. Climate Dynamics, 22, 249-266.
https://doi.org/10.1007/s00382-003-0381-x |
[8, 9]
. Other factors, such as variations in atmospheric jet stream speeds
| [10] | Kanamitsu, M., & Krishnamurti, T. N. (1978). “Northern summer tropical circulations during drought and normal rainfall months”. Monthly Weather Review, 106, 331-347.
https://doi.org/10.1175/1520-0493(1978)106<0331:NSTCDD>2.0.CO;2 |
| [11] | Sultan, B., & Janicot, S. (2003). “The West African monsoon dynamics Part 2: The “preset” and “onset” of summer monsoon”. Journal of Climate, 16, 3407-3427.
https://doi.org/10.1175/1520-0442(2003)016<3407:TWAMDP>2.0.CO;2 |
[10, 11]
or atmospheric dust concentrations
| [12] | Prospero, J. M. (1996). “The atmospheric transport of particles to the Ocean”. In V. Ittekkot, P. Schäfer, S. Honjo & P. J. Depetris (Eds.), Particle Flux in the Ocean. SCOPE Report 57, John Wiley & Sons, Chichester, 19-52. |
| [13] | N’Tchayi Mbourou, G. M., Bertrand, J., & Nicholson, S. E. (1997). “The diurnal and seasonal cycles of wind-borne dust over Africa north of the equator”. Journal of Applied Meteorology, 36, 868-882.
https://doi.org/10.1175/1520-0450(1997)036<0868:TDASCO>2.0.CO;2 |
[12, 13]
, are also cited.
This situation has led to a widespread decline in water resource availability, notably resulting in the drying up of certain wetlands such as the Niayes upon which agricultural activities heavily depend. Consequently, farmers' incomes fell by approximately 40% between the 1970s and the 1980s, exacerbating poverty and driving rural-to-urban migration
| [14] | Aguiar, L. A. A. (2002). Natural resource management and production systems on the northern coast of Senegal. University Press, Cheikh Anta Diop University, Dakar (SEN), 96 p. |
[14]
. Although numerous studies have extensively analyzed the interannual variability and cycle of the African monsoon
| [15] | Le Barbé, L., Lebel, T., & Tapsoba, D. (2002). “Rainfall variability in West Africa during the years 1950-1990”. Journal of Climate, 15, 187-202.
https://doi.org/10.1175/1520-0442(2002)015<0187:RVIWAD>2.0.CO;2 |
| [16] | Niel, H., Leduc, C., & Dieulin, C. (2005). “Characterization of the spatial and temporal variability of annual rainfall in the Lake Chad basin during the 20th century”. Hydrological Sciences Journal, 50, 223-243.
https://doi.org/10.1623/hysj.50.2.223.61800 |
[15, 16]
, interannual fluctuations during the rainy season and their impacts on the hydrological cycle and water resource availability remain insufficiently studied. Such climatic variability is of particular importance in the Niayes zone. This area constitutes an agro-ecological zone of vital importance to the Senegalese economy. It is characterized by intensive market gardening, which is closely dependent on climatic conditions specifically precipitation and temperature. However, the variability of these parameters remains insufficiently characterized at the local scale. Thus, the question arises as to the extent to which climate variability affects climatic parameters along the Thies-Louga-Saint-Louis axis. The objective of this study is therefore to analyze precipitation and temperature variability in this zone using annual data series observed over the 1994-2024 period. More specifically, the aim is to:
1) analyze temporal trends in precipitation and temperature over the 1994-2024 period;
2) assess the interannual variability of these variables by calculating standardized anomalies;
3) identify any potential breaks in the climate series during the study period.
2. Materials and Methods
2.1. Study Area Description
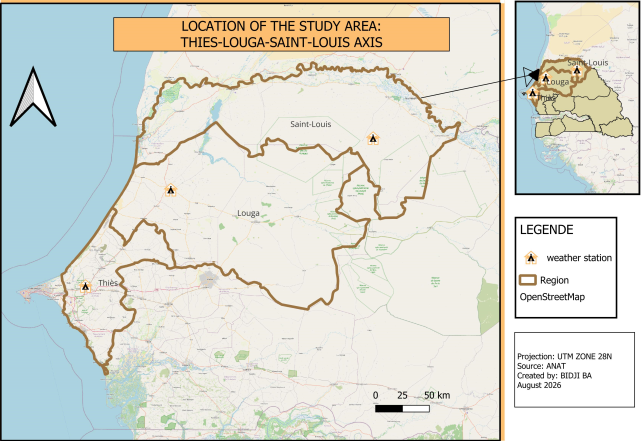
Figure 1. Location of the study area and meteorological stations.
Senegal’s northern coastline, corresponding to the western edge of the Sahel, lies between 14.3° and 16°N and 16° and 17.5°W, covering an area of approximately 2,300 km
2 (
Figure 1). The topography is characterized by sandy dunes and the Thiès plateau, the maximum elevation of which does not exceed 130 m above mean sea level. Between the sand dunes, the presence of a water table in moist depressions known as "Niayes" combined with a relatively mild coastal climate supports the persistence of forest remnants with Guinean phytogeographical affinities. These remnants are dominated notably by the oil palm (*Elaeis guineensis* Jacq)
| [17] | Trochain, J. (1940). “Contribution to the study of the vegetation of Senegal”. Memoirs of the French Institute of Black Africa. Larose, Paris, 433 p. |
[17]
and became established at the beginning of the Holocene
| [18] | Lézine, A.-M. (1987). Plant paleoenvironments of North-tropical West Africa since 12000 BP: Pollen analysis of continental sedimentary series from Senegal-Mauritania. Doctoral thesis, University of Aix-Marseille II, 151 p. |
[18]
. Outside these wetland areas, the regional vegetation consists of savannas and a Sahelian pseudo-steppe
| [19] | Aguiar, L. A. A., Gachon, P., Garneau, M., & Lézine, A.-M. (2009). “Interannual and intraseasonal variability of rainfall along the northern coast of Senegal from 1950 to 2004.” Article submitted to the Hydrogeological Sciences Journal, July 21, 2008. |
[19]
. Proximity to the ocean allows for the penetration of cool maritime air masses, resulting in relatively moderate mean annual temperatures along the coast (e.g., 24.5°C in Saint-Louis) compared to the interior (e.g., 26.5°C in Louga). The rainfall regime in this zone features a rainy season extending from June to October. Annual precipitation totals show a southward-to-northward decreasing gradient, dropping from an average of approximately 500 mm to less than 300 mm
| [19] | Aguiar, L. A. A., Gachon, P., Garneau, M., & Lézine, A.-M. (2009). “Interannual and intraseasonal variability of rainfall along the northern coast of Senegal from 1950 to 2004.” Article submitted to the Hydrogeological Sciences Journal, July 21, 2008. |
[19]
.
2.2. Methods
The climate data used in this study were collected from the National Agency for Civil Aviation and Meteorology (ANACIM). They concern annual rainfall and maximum and minimum temperatures recorded at stations in Thies, Louga, and Saint-Louis over the period 1994-2024. The sample size criterion is based on the recommendations of the World Meteorological Organization, which advocates a minimum observation period of 30 years for any study on climate change
| [20] | Faye, C., Bâ, D. D., & Diagne, A. (2019). “Climate change observed on the Senegalese coast, Dakar Region, since 1960: trends and perception of the populations of Dakar”. Afrique SCIENCE, 15(4), 203-214. |
[20]
. The average annual temperature was calculated from the maximum and minimum temperatures.
The data were then analyzed using descriptive statistics, standardized interannual anomalies, and trend analysis. Anomalies were calculated relative to the 1994-2024 average to highlight years with above- or below-average rainfall or temperature. Trends were assessed using the nonparametric Mann-Kendall test, while their magnitude was estimated using Sen's slope. The Pettitt test was also used to look for potential breaks in the time series. The statistical formulations of these different tests are presented below.
Statistical formulation of tests
The Mann-Kendall test is based on the statistic S, calculated from the sign differences between all pairs of values (xi, xj) in the time series:
where the sign function is defined by:
For a sample of size n ≥ 8, the variance of S is estimated by:
where tp denotes the number of tied values (ex aequo) in group p, and m is the number of groups of tied values. The standardized statistic Z, used to test the significance of the trend, is then calculated as follows:
A positive (negative) Z-value indicates an upward (downward) trend; the null hypothesis of no trend is rejected at the 5% level when |Z| > 1.96, which corresponds to a p-value of less than 0.05.
The magnitude of the trend was estimated using Sen’s non-parametric slope estimator, calculated for each pair of points in the series:
where xj and xk are the values observed at times j and k, respectively. Sen’s slope β then corresponds to the median of the set of slopes Qi thus obtained:
The Pettitt test made it possible to detect a potential break in the time series and to pinpoint the year in which it occurred. It is based on the statistic:
m
The test statistic Kn corresponds to the maximum absolute value of Uₜ,n over the entire series:
The significance of the break thus detected is evaluated based on the approximate critical probability, given by:
The year associated with Kn is identified as the most probable breakpoint in the series when the associated p-value is below the 5% threshold.
Data processing, statistical analyses, and graph creation were performed using Microsoft Excel 2021 and XLSTAT 2024. The results were mapped using ArcGIS 10.8.
3. Results
3.1. Descriptive Statistics of Climate Variables
Table 1. Descriptive statistics of climatic variables observed over the period (1994-2024).
Stations | Variable | Average | Minimum | Maximum | Standard deviation |
Thies | P (mm) | 474,32 | 228,60 | 664,40 | 119,5 |
Tmax (°C) | 33,28 | 30,28 | 34,54 | 0,86 |
Tmin (°C) | 20,65 | 16,28 | 22,08 | 1,21 |
Tmoy (°C) | 26,96 | 24,70 | 28,17 | 0,81 |
Louga | P (mm) | 334,21 | 149,60 | 596,60 | 100,63 |
Tmax (°C) | 35,37 | 34,03 | 37,06 | 0,78 |
Tmin (°C) | 21,24 | 20,35 | 22,64 | 0,64 |
Tmoy (°C) | 28,30 | 27,21 | 29,85 | 0,66 |
Saint-Louis | P (mm) | 289,01 | 110,80 | 587,10 | 100,82 |
Tmax (°C) | 32,42 | 31,26 | 34,21 | 0,74 |
Tmin (°C) | 20,85 | 18,20 | 22,23 | 0,70 |
Tmoy (°C) | 26,64 | 24,86 | 27,64 | 0,59 |
Table 1 presents descriptive statistics for annual rainfall, maximum temperatures (Tmax), minimum temperatures (Tmin), and average temperatures (Tmoy) observed at the Thies, Louga, and Saint-Louis stations over the period 1994-2024. The results highlight a decreasing rainfall gradient from south to north, with average rainfall of 474.32 mm in Thies, 334.21 mm in Louga, and 289.01 mm in Saint-Louis. Temperatures follow an inverse distribution. The Louga station recorded the highest maximum and average temperatures (35.37°C and 28.30°C, respectively), while Saint-Louis exhibited the lowest values, due to the oceanic influence. Rainfall shows greater interannual variability than temperatures, as indicated by their higher standard deviations. In contrast, temperatures remained relatively stable throughout the study period.
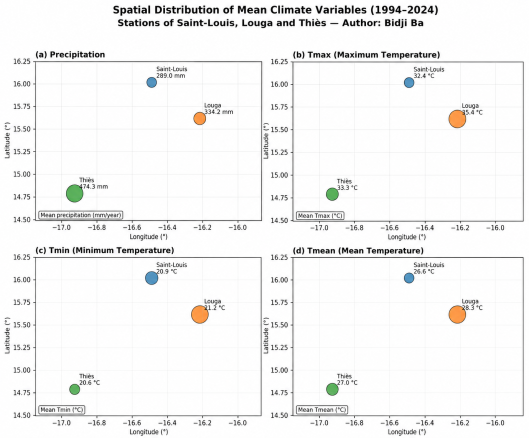
The spatial distribution of these climatic variables is illustrated by
Figure 2, which confirms the decreasing rainfall gradient from south to north as well as the inverse thermal gradient observed between the three stations.
Figure 2. Spatial distribution of average climatic variables (precipitation, Tmax, Tmin, Tavg) at the stations of Saint-Louis, Louga and Thies (1994-2024).
3.2. Analysis of the Spatial Distribution of Climate Variables
Figure 2 illustrates the spatial distribution of average annual rainfall and maximum, minimum, and average temperatures at the Thies, Louga, and Saint-Louis stations over the period 1994-2024. Panel (a) highlights a decreasing rainfall gradient along a south-north axis, with the Thies station recording the highest total (474.3 mm), followed by Louga (334.2 mm) and then Saint-Louis (289.0 mm). Panels (b), (c), and (d), relating respectively to Tmax, Tmin, and Tmoy, reveal a spatial distribution that is generally the opposite of that of rainfall. Louga stands out clearly as the warmest station, with the highest values for all three temperature indicators (Tmax = 35.4°C; Tmin = 21.2°C; Tmoy = 28.3°C), represented by the largest bubbles on the map. Saint-Louis, on the other hand, exhibits the lowest maximum and average temperatures (32.4°C and 26.6°C, respectively). The Thies station occupies an intermediate position for maximum and average temperatures, but records the lowest minimum temperature of the three stations (20.6°C), lower than that of Saint-Louis. Overall, this spatial analysis highlights a contrast between the rainfall gradient and the temperature gradient observed along the Thies-Louga-Saint-Louis axis, and provides consistent visual support for the descriptive statistics presented in
Table 1.
3.3. Analysis of Interannual Anomalies
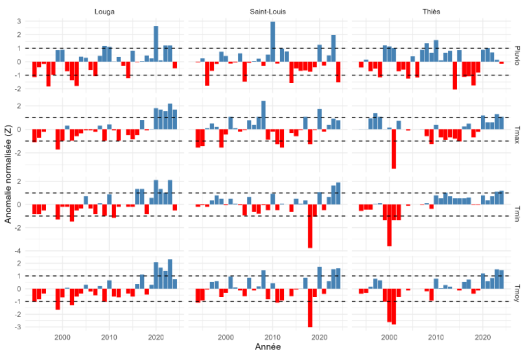
Figure 3 shows the normalized interannual anomalies of climate variables (1994-2024) for the three stations studied. Strong interannual variability in climate anomalies is observed at these three stations. For precipitation, dry and wet years alternate across all stations. In Louga, 1997 and 2003 were particularly dry years, while 2020 stands out with a strongly positive anomaly (Z=2.61). In Saint-Louis, 2010 was the wettest year (Z=2.96), while 1996, 2014, and 2024 were characterized by rainfall deficits. In Thies, 2010 was characterized by a positive anomaly (Z=1.59), while 2014 was extremely dry (Z=-2.06). Regarding temperatures, thermal anomalies also highlight an alternation between cold and warm years. Negative anomalies are more prevalent at the beginning of the period, while positive anomalies have become more frequent in recent years, particularly in Louga and Thiès, reflecting a trend towards warmer conditions. Saint-Louis, however, exhibits more irregular variability, with alternating cold and warm episodes.
Figure 3. Evolution of normalized interannual anomalies of precipitation and temperature (1994-2024).
3.4. Analysis of Climate Variability Trends
Table 2 presents the results of the Mann-Kendall test and the Sen slope estimator for the three stations studied. In Saint-Louis, no statistically significant trend was observed for precipitation or temperature, despite all Sen slopes being positive, indicating an upward trend. In Louga, a significant upward trend was observed for precipitation (τ = 0.312; p = 0.0144; Sen slope = 5.1167 mm/year), as well as for maximum (τ = 0.530; p = 0.0001), minimum (τ = 0.437; p = 0.0016), and mean (τ = 0.538; p = 0.0001) temperatures. In Thies, no significant trend was observed for precipitation or maximum temperatures, while the minimum (τ = 0.546; p = 0.0001; Sen slope = 0.0739°C/year) and average (τ = 0.409; p = 0.0026; Sen slope = 0.0483°C/year) temperatures showed a significant upward trend.
These results thus highlight significant warming in Louga and for certain temperatures in Thies.
Table 2. Trends in climatic variables according to the Mann-Kendall test and Sen's slope.
Stations | Variables | τ | p-value | Slope of Sen | Tendency |
Saint-Louis | P (mm) | 0.011 | 0.9458 | 0.1364 | NS |
Tmax (°C) | 0.166 | 0.2104 | 0.0200 | NS |
Tmin (°C) | 0.108 | 0.4203 | 0.0095 | NS |
Tmoy (°C) | 0.183 | 0.1635 | 0.0167 | NS |
Louga | P (mm) | 0.312 | 0.0144 | 5.1167 | S |
Tmax (°C) | 0.530 | 0.0001 | 0.0750 | S |
Tmin (°C) | 0.437 | 0.0016 | 0.0490 | S |
Tmoy (°C) | 0.538 | 0.0001 | 0.0554 | S |
Thies | P (mm) | 0.006 | 0.9729 | 0.0667 | NS |
Tmax (°C) | 0.056 | 0.6919 | 0.0100 | NS |
Tmin (°C) | 0.546 | 0.0001 | 0.0739 | S |
Tmoy (°C) | 0.409 | 0.0026 | 0.0483 | S |
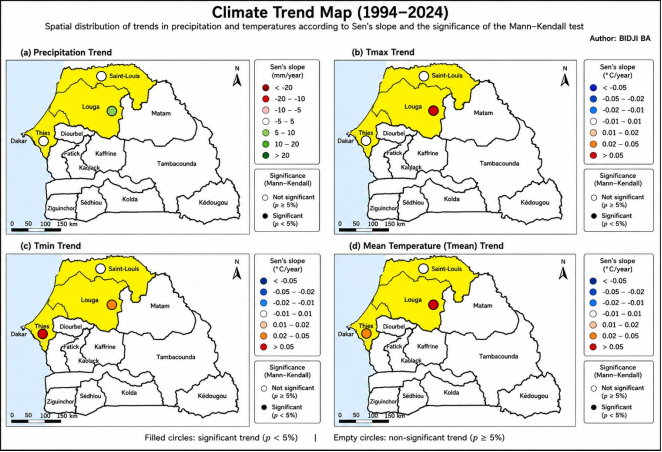
The spatial distribution of these climate trends is illustrated by
Figure 4, which highlights the stations and variables for which the detected changes are statistically significant according to the Mann-Kendall test.
Figure 4. Maps of spatio-temporal trends of precipitation and temperatures (Sen slope and significance of the Mann-Kendall test) at the stations of Saint-Louis, Louga and Thies (1994-2024).
3.5. Analysis of the Climate Trend Map
Figure 4 shows the spatial distribution of detected trends for precipitation and temperature (Tmax, Tmin, Tmoy) at the three stations, combining the slope of Sen (intensity and direction of the trend) and the significance of the Mann-Kendall test (solid circle: p < 5%; open circle: p ≥ 5%).
Panel (a) shows that no significant rainfall trend is detected in Saint-Louis and Thies, despite positive Sen slopes. Only the Louga station shows a significant increase (+5.12 mm/year; p = 0.0144).
Panels (b), (c), and (d) concern Tmax, Tmin, and Tmoy, respectively. For maximum temperature, only Louga shows a significant upward trend (+0.075°C/year; p = 0.0001), while Saint-Louis and Thies show no significant change. For minimum temperature, the trends are significant in Louga (+0.049°C/year; p = 0.0016) and Thies (+0.0739°C/year; p = 0.0001), but not in Saint-Louis. The same pattern is observed for average temperature, with significant increases in Louga (+0.0554°C/year; p = 0.0001) and Thies (+0.0483°C/year; p = 0.0026).
This spatial reading confirms that Louga is the station where warming is most marked and widespread, affecting both precipitation and all three thermal indicators, while Saint-Louis, under the moderating influence of the ocean, shows no statistically significant trend over the period 1994-2024.
3.6. Detection of Climate Disruptions
The Pettitt test in
Table 3 shows no significant break in the trend in Saint-Louis, for both precipitation and temperature, with all p-values greater than 5%. In Louga, no significant break was detected for precipitation (p-value = 0.0542). The maximum temperature showed a break in 2016 (p-value = 0.0078), with the average increasing from 34.98°C to 36.33°C. The minimum temperature showed a break in 2011 (p-value = 0.0283), rising from 20.92°C to 21.16°C. The average temperature also showed a break in 2015 (p-value = 0.0053), increasing from 27.96°C to 29.01°C. In Thies, no break was observed for precipitation or maximum temperature. Conversely, breaks were detected for the minimum temperature in 2009 (p-value = 0.0004), with an increase from 19.78°C to 21.41°C, as well as for the average temperature (p-value = 0.0216), which rose from 26.50°C to 27.37°C. Overall, these results confirm significant changes in the thermal regime in Louga and Thiès, while no clear break was detected in Saint-Louis.
Table 3. Significant climate disruptions detected by the Pettitt test.
Stations | Variable | Year of rupture | P-value | Average before | Average after |
Louga | Tmax | 2016 | 0,0078 | 34,98 | 36,33 |
Tmin | 2011 | 0,0283 | 20,92 | 21,16 |
Tmoy | 2015 | 0,0053 | 27,96 | 29,01 |
Thies | Tmin | 2009 | 0,0004 | 19,78 | 21,41 |
Tmoy | 2009 | 0,0216 | 26,50 | 27,37 |
3.7. Comparative Analysis
Comparative analysis reveals a decreasing rainfall gradient from Thies to Saint-Louis, while Louga stands out with thehighest average temperatures. Louga appears to be the station exhibiting the most pronounced climatic trends, where precipitation and all three temperature variables show a significant upward trend. For the Thies station, significant trends concern minimum and average temperatures; however, for the Saint-Louis station, no significant trend is detected. The identified breaks primarily concern temperatures at the Louga and Thies stations.
4. Discussions
The results show a decreasing rainfall gradient from south to north, with an average rainfall of 474.32 mm in Thies, 334.21 mm in Louga and 289.01 mm in Saint-Louis. This distribution confirms the spatial contrasts already described in Senegal. Mendy
particularly highlights the decrease in rainfall from south to north, while Descroix et al.
| [22] | Descroix, L., Diongue Niang, A., Panthou, G., Bodian, A., Sané, Y., Dacosta, H., Malam Abdou, M., Vandervaere, J.-P., & Quantin, G. (2015). “Recent evolution of rainfall in West Africa across two regions: Senegambia and the Middle Niger basin”. Climatology, 12, 25-43.
https://doi.org/10.4267/climatologie.1105 |
[22]
show that rainfall variations differ between the coast and the interior of the Sahel. Nouaceur and Murarescu
| [23] | Nouaceur, Z., & Murarescu, O. (2020). “Rainfall variability and trend analysis of rainfall in West Africa (Senegal, Mauritania, Burkina Faso)”. Water, 12(6), Article 1754.
https://doi.org/10.3390/w12061754 |
[23]
also attribute part of this differentiation to the position of the stations in relation to the dynamics of the West African monsoon.
The interannual variability of precipitation remains significant in the three stations studied, as shown by the standard deviations which are relatively high. The interannual anomalies show an alternation of deficit and surplus years, without uniform evolution. The years 2014 in Thies and 1997 in Louga are among the driest years, while 2020 in Louga and 2010 in Saint-Louis present strongly positive anomalies. This alternation confirms the observations of Descroix et al.
| [22] | Descroix, L., Diongue Niang, A., Panthou, G., Bodian, A., Sané, Y., Dacosta, H., Malam Abdou, M., Vandervaere, J.-P., & Quantin, G. (2015). “Recent evolution of rainfall in West Africa across two regions: Senegambia and the Middle Niger basin”. Climatology, 12, 25-43.
https://doi.org/10.4267/climatologie.1105 |
[22]
and Nouaceur and Murarescu
| [23] | Nouaceur, Z., & Murarescu, O. (2020). “Rainfall variability and trend analysis of rainfall in West Africa (Senegal, Mauritania, Burkina Faso)”. Water, 12(6), Article 1754.
https://doi.org/10.3390/w12061754 |
[23]
, which highlight the high variability of precipitation in Senegal despite the rainfall recovery observed since the 1990s.
The rainfall trend, however, appears spatially contrasting. Only the Louga station shows a significant upward trend, with a Sen slope of 5.12 mm/year, while no significant trend is detected for the Thies and Saint-Louis stations. These results are consistent with the work of Sanogo et al.
| [24] | Sanogo, S., Fink, A. H., Omotosho, J. A., Ba, A., Redl, R., & Ermert, V. (2015). “Spatio-temporal characteristics of the recent rainfall recovery in West Africa”. International Journal of Climatology, 35(15), 4589-4605.
https://doi.org/10.1002/joc.4309 |
[24]
, which shows a recovery in rainfall at several Sahelian stations, while highlighting its spatial heterogeneity. The absence of a significant trend at Saint-Louis can thus be linked to the contrast between coastal and more inland stations described by Descroix et al.
| [22] | Descroix, L., Diongue Niang, A., Panthou, G., Bodian, A., Sané, Y., Dacosta, H., Malam Abdou, M., Vandervaere, J.-P., & Quantin, G. (2015). “Recent evolution of rainfall in West Africa across two regions: Senegambia and the Middle Niger basin”. Climatology, 12, 25-43.
https://doi.org/10.4267/climatologie.1105 |
[22]
.
Temperatures at the three studied stations show a different spatial gradient from that of precipitation. The Louga station records the highest average temperatures, with 35.37°C for Tmax, 21.24°C for Tmin, and 28.30°C for Tmoy. Conversely, the Saint-Louis station exhibits the lowest values for Tmax and Tmoy. This contrast may be linked to the stations' location relative to the Atlantic Ocean. The maritime influence may contribute to moderating temperatures along the coast, while the distance from the ocean for the Louga station may favor more continental thermal conditions. This interpretation aligns with the findings of Mendy
and Nouaceur and Murarescu
| [23] | Nouaceur, Z., & Murarescu, O. (2020). “Rainfall variability and trend analysis of rainfall in West Africa (Senegal, Mauritania, Burkina Faso)”. Water, 12(6), Article 1754.
https://doi.org/10.3390/w12061754 |
[23]
.
The low dispersion of temperatures relative to precipitation also indicates more limited interannual variability in the thermal regime. This observation confirms the results of the work by Kouao et al.
| [25] | Kouao, J.-M., Tagnon, B. O., Koffi, B., Kouassi, A. M., Kouassi, K. A., & Goné, D. L. (2024). “Variability and interannual trends of climate across Côte d’Ivoire over the period 1961-2016”. European Scientific Journal, 20(33), 218-240.
https://doi.org/10.19044/esj.2024.v20n33p218 |
[25]
, which show that temperature variability is generally less significant than precipitation variability.
Thermal trends constitute the main findings of this study. Indeed, the Louga station shows a significant upward trend for all temperatures (Tmax, Tmin, and Tmoy). For the Thies station, a significant increase is observed for both minimum and average temperatures. The Saint-Louis station shows no statistically significant temperature trends.
These results are consistent with the broader context of warming observed in West Africa. Kouao et al.
| [25] | Kouao, J.-M., Tagnon, B. O., Koffi, B., Kouassi, A. M., Kouassi, K. A., & Goné, D. L. (2024). “Variability and interannual trends of climate across Côte d’Ivoire over the period 1961-2016”. European Scientific Journal, 20(33), 218-240.
https://doi.org/10.19044/esj.2024.v20n33p218 |
[25]
highlight a rise in temperatures in Côte d'Ivoire, while Kaboré et al.
| [26] | Kabore, P. N., Ouedraogo, A., Sanon, M., Yaka, P., & Some, L. (2017). “Characterization of climate variability in the Centre-North region of Burkina Faso between 1961 and 2015”. Climatology, 14, 82-95. https://doi.org/10.4267/climatologie.1268 |
[26]
note an increase in temperatures in north-central Burkina Faso. The Sen slope obtained for maximum temperature (Tmax) at the Louga station, 0.075°C/year, reflects a particularly marked trend over the study period. However, comparisons with other regions should be interpreted with caution, as climatic contexts and observation periods may differ. The greater increase in minimum temperatures than maximum temperatures recorded at the Thies station is also noteworthy. At this station, the Sen slope reaches 0.00739°C/year for minimum temperatures compared to 0.010°C/year for maximum temperatures. This finding confirms the trends reported by Nouaceur and Murarescu
| [27] | Nouaceur, Z., & Murarescu, O. (2016). “Rainfall variability and trend analysis of annual rainfall in North Africa”. International Journal of Atmospheric Sciences, 2016, Article 7230450.
https://doi.org/10.1155/2016/7230450 |
[27]
regarding the increase in minimum temperatures in North African regions. This could have long-term effects on the water balance through evapotranspiration.
The Pettitt test results reveal significant breaks, primarily in temperature. At the Louga station, breaks were observed in 2009, 2015, and 2016 for minimum, average, and maximum temperatures, respectively. At the Thies station, breaks were detected in 2009 for both maximum and minimum temperatures. In contrast, no significant breaks were observed at the Saint-Louis station. The concentration of these breaks between 2009 and 2016 reinforces the observation of a recent change in the thermal regime at Louga and Thies. While the contrast with Saint-Louis may be due to the moderating effect of the coastal environment described in Mendy's work
, a direct attribution of these breaks to oceanic influence alone cannot be established based solely on the climate series analyzed in this study.
5. Conclusions
This study aimed to analyze the variability of rainfall and temperatures along the Thies-Louga-Saint-Louis axis over the period 1994-2024, through the study of temporal trends, interannual variability, and breaks in the climate series.
The results show a rainfall gradient decreasing from south to north, with average rainfall decreasing from 474.3 mm in Thies to 289.0 mm in Saint-Louis, while temperatures follow an inverse distribution, with the Louga station recording the highest values. The analysis of interannual anomalies reveals strong rainfall variability, marked by alternating dry and wet years at the three stations, while the temperature anomalies reflect a gradual shift towards warmer conditions, particularly in recent decades. The trend analysis, conducted using the Mann-Kendall test and Sen's slope, highlights a significant increase in rainfall in Louga, as well as significant warming in Louga (for all three temperature variables) and in Thies (minimum and average temperatures), while no significant trend is detected in Saint-Louis. Finally, the Pettitt test reveals primarily thermal breaks, concentrated between 2009 and 2016 in Louga and Thiès, with no significant break in Saint-Louis.
These results meet the objectives set out in the introduction and confirm a marked spatial differentiation of climate change along the northern coast of Senegal: Louga appears as the warmest station and the most affected by climate trends and disruptions, Thies shows more limited but significant warming, while Saint-Louis stands out for its relative stability, probably linked to the moderating effect of the Atlantic Ocean.
This study, however, has some limitations. It is based on only three meteorological stations, which limits the spatial representativeness of the results across the entire northern Senegalese coastline. The 30-year observation period, although in line with the minimum threshold recommended by the World Meteorological Organization, remains relatively short for fully understanding longer-term climate cycles. Furthermore, attributing the detected disruptions solely to the effects of oceanic influence remains a hypothesis that cannot be confirmed based on the analyzed climate series alone, in the absence of other explanatory variables (atmospheric circulation, sea surface temperatures, land cover).
These limitations open up several avenues for research. Extending the analysis to a denser network of stations, possibly supplemented by reanalysis or remote sensing data, would be relevant to better characterize the spatial variability of the climate in the Niayes region. Furthermore, combining these climate results with hydrological and agricultural data would allow for a better assessment of the concrete consequences of this variability on water resource availability and on vegetable yields, a major economic activity in the region. Finally, the use of future climate projections could complement this retrospective approach and provide useful information for adapting populations and water resource management policies in this sensitive agro-ecological zone.
Abbreviations
ANACIM | National Civil Aviation and Meteorology Agency |
GHG | Greenhouse Gases |
mm | Millimeter |
NS | Not Significant (non-significant Trend) |
S | Significant (Significant Trend) |
OMM | World Meteorological Organization |
p (p-value) | Critical Probability Associated with a Statistical Test |
Tmax | Maximum Temperature |
Tmin | Minimum Temperature |
Tmoy | Average Temperature |
τ (tau) | Mann-Kendall Test Correlation Coefficient |
Z | Standardized Anomaly Index (Z-score) |
Author Contributions
Bidji Ba: Conceptualization, Data curation, Resources
Alassane Thiam: Conceptualization, Methodology, Supervision, Validation, Writing – review & editing
Ahmed Dame Mboup: Visualization, Writing – original draft
Conflicts of Interest
The authors declare that they have no conflicts of interest.
References
| [1] |
Sultan, B., Baron, C., Dingkuhn, M., Sarr, B., & Janicot, S. (2005). “Climate variability in West Africa at seasonal scales: Applications to the sensitivity of agricultural yields in the Sahel”. Drought, 16, 23-33.
|
| [2] |
Gachon, P., Gauthier, N., Bokoye, A., Parishkura, D., Cotnoir, A., Tremblay, Y., & Vigeant, G. (2007). Working Group II: Variability, extremes and climate change in the Sahel: from observation to modelling, in Report of Canadian contributions to the CIDA-CILSS project: Supporting adaptation capacities to climate change. Environment Canada, A030978-002.
|
| [3] |
Nicholson, S. E. (1980). “The nature of rainfall fluctuations in subtropical West Africa”. Monthly Weather Review, 108(4), 473-487.
https://doi.org/10.1175/1520-0493(1980)108<0473:TNORFI>2.0.CO;2
|
| [4] |
Held, I. M., Delworth, T. L., Lu, J., Findell, K. U., & Knutson, T. R. (2005). “Simulation of Sahel drought in the 20th and 21st centuries”. Proceedings of the National Academy of Sciences, 102(50), 17891-17896.
https://doi.org/10.1073/pnas.0509057102
|
| [5] |
Paeth, H., & Hense, A. (2004). “SST versus climate change signals in West African rainfall: 20th-century variations and future projections”. Climate Change, 65(1), 179-208.
https://doi.org/10.1023/B:CLIM.0000037508.88115.8a
|
| [6] |
Xue, Y., & Shukla, J. (1993). “The influence of land surface properties on Sahel climate. Part I: Desertification”. Journal of Climate, 6, 2232-2245.
https://doi.org/10.1175/1520-0442(1993)006<2232:TIOLSP>2.0.CO;2
|
| [7] |
Zheng, X., & Eltahir, E. A. B. (1998). “The role of vegetation in dynamics of West African Monsoon”. Journal of Climate, 11, 2078-2096.
https://doi.org/10.1175/1520-0442(1998)011<2078:TROVIT>2.0.CO;2
|
| [8] |
Rowell, D. P. (2003). “The Impact of Mediterranean SSTs on the Sahelian rainfall season”. Journal of Climate, 16, 849-862.
https://doi.org/10.1175/1520-0442(2003)016<0849:TIOMSO>2.0.CO;2
|
| [9] |
Messager, C., Gallée, H., & Brasseur, O. (2004). “Precipitation sensitivity to regional SST in a regional climate simulation during the West African monsoon for two dry years”. Climate Dynamics, 22, 249-266.
https://doi.org/10.1007/s00382-003-0381-x
|
| [10] |
Kanamitsu, M., & Krishnamurti, T. N. (1978). “Northern summer tropical circulations during drought and normal rainfall months”. Monthly Weather Review, 106, 331-347.
https://doi.org/10.1175/1520-0493(1978)106<0331:NSTCDD>2.0.CO;2
|
| [11] |
Sultan, B., & Janicot, S. (2003). “The West African monsoon dynamics Part 2: The “preset” and “onset” of summer monsoon”. Journal of Climate, 16, 3407-3427.
https://doi.org/10.1175/1520-0442(2003)016<3407:TWAMDP>2.0.CO;2
|
| [12] |
Prospero, J. M. (1996). “The atmospheric transport of particles to the Ocean”. In V. Ittekkot, P. Schäfer, S. Honjo & P. J. Depetris (Eds.), Particle Flux in the Ocean. SCOPE Report 57, John Wiley & Sons, Chichester, 19-52.
|
| [13] |
N’Tchayi Mbourou, G. M., Bertrand, J., & Nicholson, S. E. (1997). “The diurnal and seasonal cycles of wind-borne dust over Africa north of the equator”. Journal of Applied Meteorology, 36, 868-882.
https://doi.org/10.1175/1520-0450(1997)036<0868:TDASCO>2.0.CO;2
|
| [14] |
Aguiar, L. A. A. (2002). Natural resource management and production systems on the northern coast of Senegal. University Press, Cheikh Anta Diop University, Dakar (SEN), 96 p.
|
| [15] |
Le Barbé, L., Lebel, T., & Tapsoba, D. (2002). “Rainfall variability in West Africa during the years 1950-1990”. Journal of Climate, 15, 187-202.
https://doi.org/10.1175/1520-0442(2002)015<0187:RVIWAD>2.0.CO;2
|
| [16] |
Niel, H., Leduc, C., & Dieulin, C. (2005). “Characterization of the spatial and temporal variability of annual rainfall in the Lake Chad basin during the 20th century”. Hydrological Sciences Journal, 50, 223-243.
https://doi.org/10.1623/hysj.50.2.223.61800
|
| [17] |
Trochain, J. (1940). “Contribution to the study of the vegetation of Senegal”. Memoirs of the French Institute of Black Africa. Larose, Paris, 433 p.
|
| [18] |
Lézine, A.-M. (1987). Plant paleoenvironments of North-tropical West Africa since 12000 BP: Pollen analysis of continental sedimentary series from Senegal-Mauritania. Doctoral thesis, University of Aix-Marseille II, 151 p.
|
| [19] |
Aguiar, L. A. A., Gachon, P., Garneau, M., & Lézine, A.-M. (2009). “Interannual and intraseasonal variability of rainfall along the northern coast of Senegal from 1950 to 2004.” Article submitted to the Hydrogeological Sciences Journal, July 21, 2008.
|
| [20] |
Faye, C., Bâ, D. D., & Diagne, A. (2019). “Climate change observed on the Senegalese coast, Dakar Region, since 1960: trends and perception of the populations of Dakar”. Afrique SCIENCE, 15(4), 203-214.
|
| [21] |
Mendy, A. (2023). “Rainfall variability in the 20th century in Dakar, Senegal”. Norois, 268-269, 109-127.
https://doi.org/10.4000/norois.13884
|
| [22] |
Descroix, L., Diongue Niang, A., Panthou, G., Bodian, A., Sané, Y., Dacosta, H., Malam Abdou, M., Vandervaere, J.-P., & Quantin, G. (2015). “Recent evolution of rainfall in West Africa across two regions: Senegambia and the Middle Niger basin”. Climatology, 12, 25-43.
https://doi.org/10.4267/climatologie.1105
|
| [23] |
Nouaceur, Z., & Murarescu, O. (2020). “Rainfall variability and trend analysis of rainfall in West Africa (Senegal, Mauritania, Burkina Faso)”. Water, 12(6), Article 1754.
https://doi.org/10.3390/w12061754
|
| [24] |
Sanogo, S., Fink, A. H., Omotosho, J. A., Ba, A., Redl, R., & Ermert, V. (2015). “Spatio-temporal characteristics of the recent rainfall recovery in West Africa”. International Journal of Climatology, 35(15), 4589-4605.
https://doi.org/10.1002/joc.4309
|
| [25] |
Kouao, J.-M., Tagnon, B. O., Koffi, B., Kouassi, A. M., Kouassi, K. A., & Goné, D. L. (2024). “Variability and interannual trends of climate across Côte d’Ivoire over the period 1961-2016”. European Scientific Journal, 20(33), 218-240.
https://doi.org/10.19044/esj.2024.v20n33p218
|
| [26] |
Kabore, P. N., Ouedraogo, A., Sanon, M., Yaka, P., & Some, L. (2017). “Characterization of climate variability in the Centre-North region of Burkina Faso between 1961 and 2015”. Climatology, 14, 82-95.
https://doi.org/10.4267/climatologie.1268
|
| [27] |
Nouaceur, Z., & Murarescu, O. (2016). “Rainfall variability and trend analysis of annual rainfall in North Africa”. International Journal of Atmospheric Sciences, 2016, Article 7230450.
https://doi.org/10.1155/2016/7230450
|
| [28] |
IPCC (2022). “Africa”. In: Climate Change 2022: Impacts, Adaptation and Vulnerability. Contribution of Working Group II to the Sixth Assessment Report of the Intergovernmental Panel on Climate Change. Cambridge University Press, Cambridge, UK, pp. 1285-1456.
https://doi.org/10.1017/9781009325844.011
|
| [29] |
Chawanda, C. J., Nkwasa, A., Thiery, W., & van Griensven, A. (2024). “Combined impacts of climate and land-use change on future water resources in Africa”. Hydrology and Earth System Sciences, 28(1), 117-138.
https://doi.org/10.5194/hess-28-117-2024
|
Cite This Article
-
APA Style
Ba, B., Thiam, A., Mboup, A. D. (2026). Climate Variability Along the Northern Coast of Senegal: Analysis of Trends, Anomalies and Breaks at the Stations of Thies, Louga and Saint-louis (1994-2024). International Journal of Environmental Monitoring and Analysis, 14(5), 167-177. https://doi.org/10.11648/j.ijema.20261405.13
 Copy
|
 Download
ACS Style
Ba, B.; Thiam, A.; Mboup, A. D. Climate Variability Along the Northern Coast of Senegal: Analysis of Trends, Anomalies and Breaks at the Stations of Thies, Louga and Saint-louis (1994-2024). Int. J. Environ. Monit. Anal. 2026, 14(5), 167-177. doi: 10.11648/j.ijema.20261405.13
Copy
|
Download
AMA Style
Ba B, Thiam A, Mboup AD. Climate Variability Along the Northern Coast of Senegal: Analysis of Trends, Anomalies and Breaks at the Stations of Thies, Louga and Saint-louis (1994-2024). Int J Environ Monit Anal. 2026;14(5):167-177. doi: 10.11648/j.ijema.20261405.13
Copy
|
Download
-
@article{10.11648/j.ijema.20261405.13,
  author = {Bidji Ba and Alassane Thiam and Ahmed Dame Mboup},
  title = {Climate Variability Along the Northern Coast of Senegal: Analysis of Trends, Anomalies and Breaks at the Stations of Thies, Louga and Saint-louis (1994-2024)},
  journal = {International Journal of Environmental Monitoring and Analysis},
  volume = {14},
  number = {5},
  pages = {167-177},
  doi = {10.11648/j.ijema.20261405.13},
  url = {https://doi.org/10.11648/j.ijema.20261405.13},
  eprint = {https://article.sciencepublishinggroup.com/pdf/10.11648.j.ijema.20261405.13},
  abstract = {The northern coast of Senegal, located on the western edge of the Sahel, is characterized by high climate variability, the repercussions of which directly affect the region's socio-economic activities, particularly market gardening in the Niayes area. This study aims to analyze the variability of rainfall and temperatures at the Thies, Louga, and Saint-Louis weather stations over the period 1994-2024, through the study of temporal trends, interannual anomalies, and breaks in the climate series. The data, provided by the National Civil Aviation and Meteorology Agency (ANACIM), were processed using the Mann-Kendall test, the Sen slope test, and the Pettitt test. The results reveal a rainfall gradient decreasing from south to north, with average rainfall decreasing from 474.3 mm in Thies to 289.0 mm in Saint-Louis, and a reverse temperature gradient, with the Louga station recording the highest temperatures. Trend analysis reveals a significant increase in rainfall and temperatures in Louga, a significant but more limited warming in Thies (minimum and average temperatures), and the absence of a significant trend in Saint-Louis. The Pettitt test reveals primarily thermal breaks, concentrated between 2009 and 2016 in Louga and Thies, with no break detected in Saint-Louis. These results reflect a marked spatial differentiation of climate change along the northern Senegalese coast, likely linked to the moderating effect of the Atlantic Ocean, and underscore the need for continuous climate monitoring to anticipate impacts on water resources and agricultural activities in the region.},
 year = {2026}
}
Copy
|
Download
-
TY  - JOUR
T1  - Climate Variability Along the Northern Coast of Senegal: Analysis of Trends, Anomalies and Breaks at the Stations of Thies, Louga and Saint-louis (1994-2024)
AU  - Bidji Ba
AU  - Alassane Thiam
AU  - Ahmed Dame Mboup
Y1  - 2026/10/20
PY  - 2026
N1  - https://doi.org/10.11648/j.ijema.20261405.13
DO  - 10.11648/j.ijema.20261405.13
T2  - International Journal of Environmental Monitoring and Analysis
JF  - International Journal of Environmental Monitoring and Analysis
JO  - International Journal of Environmental Monitoring and Analysis
SP  - 167
EP  - 177
PB  - Science Publishing Group
SN  - 2328-7667
UR  - https://doi.org/10.11648/j.ijema.20261405.13
AB  - The northern coast of Senegal, located on the western edge of the Sahel, is characterized by high climate variability, the repercussions of which directly affect the region's socio-economic activities, particularly market gardening in the Niayes area. This study aims to analyze the variability of rainfall and temperatures at the Thies, Louga, and Saint-Louis weather stations over the period 1994-2024, through the study of temporal trends, interannual anomalies, and breaks in the climate series. The data, provided by the National Civil Aviation and Meteorology Agency (ANACIM), were processed using the Mann-Kendall test, the Sen slope test, and the Pettitt test. The results reveal a rainfall gradient decreasing from south to north, with average rainfall decreasing from 474.3 mm in Thies to 289.0 mm in Saint-Louis, and a reverse temperature gradient, with the Louga station recording the highest temperatures. Trend analysis reveals a significant increase in rainfall and temperatures in Louga, a significant but more limited warming in Thies (minimum and average temperatures), and the absence of a significant trend in Saint-Louis. The Pettitt test reveals primarily thermal breaks, concentrated between 2009 and 2016 in Louga and Thies, with no break detected in Saint-Louis. These results reflect a marked spatial differentiation of climate change along the northern Senegalese coast, likely linked to the moderating effect of the Atlantic Ocean, and underscore the need for continuous climate monitoring to anticipate impacts on water resources and agricultural activities in the region.
VL  - 14
IS  - 5
ER  -
Copy
|
Download





 Share This Article
 Twitter
 Linked In
 Facebook
