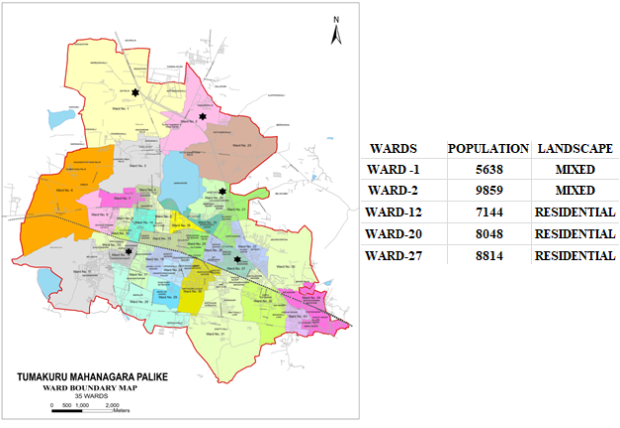
One of the major issues facing in tier-II cities like Tumakuru is the Efficient implementation Of Integrated Municipal Solid Waste Management. In order to choose the best Scientific Waste Treatment Technologies and Management Strategies for Tumakuru city, the amount and Composition of Municipal Solid Waste (MSW) differ considerably over the course of three distinct seasons. In order to ascertain the average per capita waste generation in each of Tumakuru City Corporation's (TCC) thirty-five wards, household data was gathered through a survey. Waste samples from 1050 households in each of the three seasons were recorded in order to calculate the average Household generation for five wards. According to the study's findings, the total amount of waste produced by Tumakuru city's households can be estimated at 110 TPD. And the results show that MSW samples have seasonal variation in Moisture content ranging from 27.52% to 41.2%, with an average of 34.46% which is suitable for composting and Biomethanation. The Calorific value having medium energy recovery potential which is suitable for refuse derived fuel (RDF). The overall results of MSW revealed significant seasonal effects on Moisture content, TOC, and Nutrient Parameters, confirming that climatic conditions strongly influence waste characteristics.
| Published in | International Journal of Environmental Monitoring and Analysis (Volume 14, Issue 2) |
| DOI | 10.11648/j.ijema.20261402.13 |
| Page(s) | 89-100 |
| Creative Commons |
This is an Open Access article, distributed under the terms of the Creative Commons Attribution 4.0 International License (http://creativecommons.org/licenses/by/4.0/), which permits unrestricted use, distribution and reproduction in any medium or format, provided the original work is properly cited. |
| Copyright |
Copyright © The Author(s), 2026. Published by Science Publishing Group |
Municipal Solid Waste (MSW), Waste Generation Rate, Physical Composition, Tumakuru
SL. NO. | TEST NAME | METHOD |
|---|---|---|
1 | pH | pH meter |
2 | EC | Conductivity meter |
3 | Moisture content | Gravimetric method |
4 | Calorific Value | Bomb calorimeter |
5 | Total Nitrogen | Kjeldhal method |
6 | Total Organic Carbon | Walkey and Black method |
7 | Potassium | Flame photometric |
8 | Phosphorous | Vanadomolybdo phosphoric Acid Colorimetric method |
9 | C/N | C/N ratio is determined from the ratio of total Organic carbon to total nitrogen |
10 | Organic Matter | OM=TOC X 1.724 |
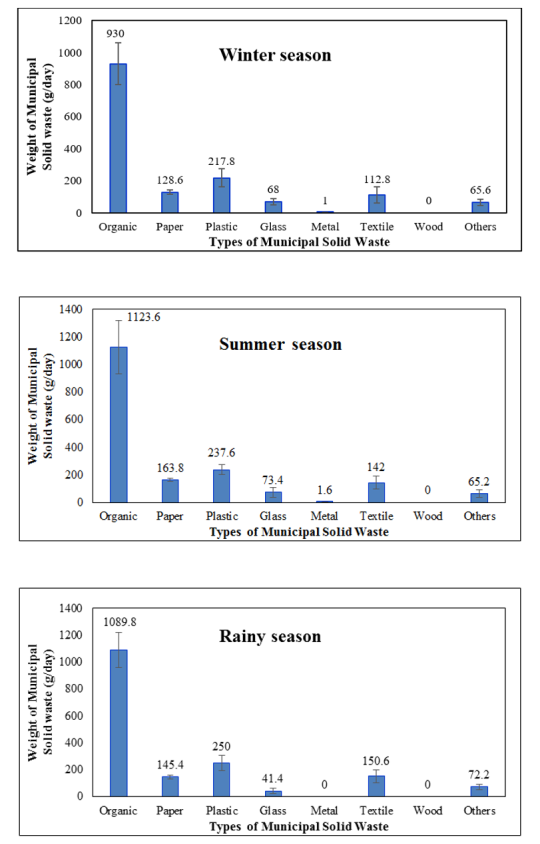
Types of Waste | Lowest (%) | Highest (%) | Average (%) |
|---|---|---|---|
Organics | 58.08(AP) | 63.82(AP) | 61.79 |
Paper | 7.51(AP) | 10.87(AP) | 8.66 |
Plastics | 11.34(AP) | 15.57(N) | 13.87 |
Glass | 0.84(N) | 6.22(AP) | 3.71 |
Metal | 0.09 (AP) | 0.28(AP) | 0.04 |
Textile | 4.73(N) | 10.53(N) | 7.82 |
Wood | 0 | 0 | 0 |
Others | 1.43(AP) | 6.55(AP) | 4.05 |
WARDS | 1 | 2 | 3 | 4 | 5 | AVG. | |
|---|---|---|---|---|---|---|---|
ORGANIC | NOV | 60.95 | 62.03 | 60.45 | 58.98 | 62.29 | 60.94 |
APRIL | 63.31 | 62.11 | 63.82 | 58.08 | 62.64 | 61.99 | |
AUG | 62.25 | 61.66 | 61.07 | 65.9 | 61.32 | 62.44 | |
AVG. | 62.17 | 61.93 | 61.78 | 60.98 | 62.08 | 61.79 | |
PAPER | NOV | 8.1 | 7.94 | 9.34 | 8.57 | 8.13 | 8.41 |
APRIL | 9.48 | 8.39 | 8.51 | 10.22 | 9.11 | 9.14 | |
AUG | 7.54 | 7.58 | 7.51 | 10.87 | 8.62 | 8.42 | |
AVG. | 8.37 | 7.97 | 8.45 | 9.88 | 8.62 | 8.66 | |
PLASTIC | NOV | 12.4 | 14.19 | 15.57 | 15.29 | 13.87 | 14.26 |
APRIL | 13.16 | 11.34 | 13.85 | 14.43 | 13.22 | 13.2 | |
AUG | 13.66 | 14.67 | 15.54 | 11.67 | 15.27 | 14.16 | |
AVG. | 13.07 | 13.4 | 14.98 | 13.79 | 14.12 | 13.87 | |
GLASS | NOV | 5.77 | 5.88 | 0.84 | 4.53 | 5.81 | 4.56 |
APRIL | 4.61 | 4.69 | 0.88 | 4.54 | 6.22 | 4.18 | |
AUG | 2.87 | 2.79 | 1.27 | 1.14 | 3.91 | 2.39 | |
AVG. | 4.41 | 4.45 | 0.99 | 3.40 | 5.31 | 3.71 | |
METAL | NOV | 0.35 | 0 | 0 | 0 | 0 | 0.07 |
APRIL | 0 | 0.09 | 0.28 | 0 | 0 | 0.074 | |
AUG | 0 | 0 | 0 | 0 | 0 | 0 | |
AVG. | 0.11 | 0.03 | 0.09 | 0 | 0 | 0.04 | |
TEXTILE | NOV | 7.11 | 4.73 | 10.53 | 6.79 | 7.42 | 7.31 |
APRIL | 7.98 | 9.29 | 9.21 | 6.14 | 5.94 | 7.71 | |
AUG | 9.4 | 9.83 | 9.77 | 5.3 | 7.88 | 8.43 | |
AVG. | 8.16 | 7.95 | 9.83 | 6.07 | 7.08 | 7.82 | |
WOOD | NOV | 0 | 0 | 0 | 0 | 0 | 0 |
APRIL | 0 | 0 | 0 | 0 | 0 | 0 | |
AUG | 0 | 0 | 0 | 0 | 0 | 0 | |
AVG. | 0 | 0 | 0 | 0 | 0 | 0 | |
OTHERS | NOV | 5.28 | 5.21 | 3.22 | 5.82 | 2.45 | 4.39 |
APRIL | 1.43 | 4.04 | 3.41 | 6.55 | 2.83 | 3.65 | |
AUG | 4.25 | 3.44 | 4.81 | 5.1 | 2.97 | 4.11 | |
AVG. | 3.65 | 4.23 | 3.81 | 5.82 | 2.75 | 4.05 |
WARDS | 1 | 2 | 3 | 4 | 5 | AVG. | |
|---|---|---|---|---|---|---|---|
pH | NOV | 7 | 7.4 | 7.1 | 7.6 | 6.9 | 7.2 |
APRIL | 6.8 | 7.4 | 7.5 | 7.2 | 6.6 | 7.1 | |
AUG | 6.9 | 7 | 6.6 | 6.8 | 7.2 | 6.9 | |
AVG. | 6.9 | 7.26 | 7.06 | 7.2 | 6.9 | 7.0 | |
EC (mho/cm) | NOV | 3.15 | 3.95 | 3.9 | 3.06 | 3.69 | 3.55 |
APRIL | 3.74 | 3.89 | 3.83 | 3.16 | 3.48 | 3.62 | |
AUG | 3.21 | 3.38 | 4.2 | 3.2 | 3.46 | 3.49 | |
AVG. | 3.36 | 3.74 | 3.97 | 3.14 | 3.54 | 3.55 | |
Moisture content (%) | NOV | 34.1 | 39.5 | 40.9 | 33.58 | 35.92 | 36.8 |
APRIL | 27.52 | 28.88 | 28.32 | 28.42 | 27.86 | 28.2 | |
AUG | 37.2 | 39.6 | 41.2 | 38.8 | 35.2 | 38.4 | |
AVG. | 32.94 | 35.99 | 36.80 | 33.6 | 32.99 | 34.46 | |
Calorific Value (kcal/kg) | NOV | 764 | 952 | 988 | 790 | 796 | 858 |
APRIL | 917 | 948 | 814 | 885 | 1036 | 920 | |
AUG | 759 | 798 | 768 | 781 | 854 | 792 | |
AVG. | 813.33 | 899.33 | 856.66 | 818.66 | 895.33 | 856.66 | |
Total Nitrogen (%) | NOV | 0.68 | 0.76 | 0.87 | 0.62 | 0.67 | 0.72 |
APRIL | 0.51 | 0.55 | 0.53 | 0.52 | 0.54 | 0.53 | |
AUG | 0.86 | 0.92 | 0.97 | 0.87 | 0.83 | 0.89 | |
AVG. | 0.68 | 0.74 | 0.79 | 0.67 | 0.68 | 0.71 | |
Total Organic Carbon (%) | NOV | 24.32 | 25.14 | 25.48 | 22.39 | 24.42 | 24.35 |
APRIL | 16.02 | 16.48 | 16.32 | 16.29 | 16.14 | 16.25 | |
AUG | 30.25 | 28.71 | 32.54 | 28.96 | 26.94 | 29.48 | |
AVG. | 23.53 | 23.44 | 24.78 | 22.54 | 22.5 | 23.36 | |
Potassium (%) | NOV | 0.39 | 0.48 | 0.49 | 0.43 | 0.46 | 0.45 |
APRIL | 0.44 | 0.54 | 0.49 | 0.47 | 0.51 | 0.49 | |
AUG | 0.95 | 0.91 | 0.98 | 0.93 | 0.88 | 0.93 | |
AVG. | 0.59 | 0.64 | 0.65 | 0.61 | 0.61 | 0.62 | |
Phosphorous (%) | NOV | 0.37 | 0.47 | 0.47 | 0.34 | 0.45 | 0.42 |
APRIL | 0.39 | 0.47 | 0.45 | 0.43 | 0.41 | 0.43 | |
AUG | 0.63 | 0.58 | 0.67 | 0.61 | 0.56 | 0.61 | |
AVG. | 0.46 | 0.50 | 0.53 | 0.46 | 0.47 | 0.48 | |
C/N (%) | NOV | 32.78 | 34.74 | 34.58 | 32.3 | 34.65 | 33.81 |
APRIL | 29.56 | 31.76 | 29.48 | 30.12 | 32.38 | 30.66 | |
AUG | 33.21 | 35.61 | 30.78 | 32.44 | 33.56 | 33.12 | |
AVG. | 31.85 | 34.03 | 31.61 | 31.62 | 33.53 | 32.53 | |
Organic Matter (%) | NOV | 39.65 | 45.1 | 44.85 | 37.72 | 42.53 | 41.97 |
APRIL | 27.28 | 28.76 | 27.8 | 27.65 | 28.61 | 28.02 | |
AUG | 51.86 | 49.78 | 52.81 | 50.96 | 48.69 | 50.82 | |
AVG. | 39.5967 | 41.2133 | 41.82 | 38.7767 | 39.9433 | 40.27 |
Sl. No | Contents | Lowest (%) | Highest (%) | Average (%) |
|---|---|---|---|---|
1 | pH | 6.9(AP) | 7.6(N) | 7.1 |
2 | EC | 3.06(N) | 4.2(AU) | 3.55 |
3 | Moisture content (%) | 27.52(AP) | 41.2(AU) | 34.46 |
4 | Calorific Value (kcal/kg) | 759(AU) | 1036(AP) | 857 |
5 | Total Nitrogen (%) | 0.51(AP) | 0.97(AU) | 0.71 |
6 | Total Organic Carbon (%) | 16.02(AP) | 32.54(AU) | 23.36 |
7 | Potassium (%) | 0.39(AP) | 0.98(AU) | 0.62 |
8 | Phosphorous (%) | 0.34(N) | 0.67(AU) | 0.49 |
9 | C/N (%) | 29.48(AP) | 35.61(AU) | 32.53 |
10 | Organic Matter (%) | 27.28(AP) | 52.81(AU) | 40.27 |
Sl. No | Parameters | Winter | Summer | Rainy |
|---|---|---|---|---|
1 | Moisture Content (%) | 36.8 | 28.2 | 38.4 |
2 | Total Organic Carbon (%) | 0.72 | 0.53 | 0.89 |
3 | Total Nitrogen (%) | 0.42 | 0.43 | 0.61 |
4 | Phosphorous (%) | 0.45 | 0.49 | 0.93 |
5 | Potassium (%) | 24.35 | 16.25 | 29.48 |
6 | Calorific Value (kcal/kg) | 858 | 920 | 792 |
AP | April |
AU | August |
N | November |
EC | Electrical Conductivity |
C/N | Carbon Nitrogen Ratio |
MSW | Municipal Solid Waste |
TOC | Total Organic Carbon |
RDF | Refused Derived Fuel |
TPD | Tonnes per Day |
| [1] | Tchobanoglous, G., Theisen, H. and Vigil, S. 1993. Integrated solid waste management: Engineering principles and management issues: Mc Grew Hill. New York. |
| [2] | Central Pollution Control Board (CPCB). (2016). Solid Waste Management Rules, 2016. Ministry of Environment, Forest and Climate Change, Government of India. |
| [3] | Sharma, A. K. & Gupta, D. P. (2006). Physico-chemical characteristics of Municipal Solid Waste of Bhopal City - A case study. 25. 871-876. |
| [4] | Thitame, S. N., Pondhe, G. M., Meshran, D. C., 2010. Characteristics and composition of MSW generated in Sangammer city, District Ahmednagar, Maharashtra. Environmental Monitoring and Assessment 170, 1–5. |
| [5] | Ogwueleka, T. C. (2013). Survey of household waste composition and quantities in Abuja, Nigeria. Resources, Conservation and Recycling, 77, 52–60. |
| [6] | Moftah, W. A. S., Marković, D., Moftah, O. A. S., & Nesseef, L. (2016). Characterization of Household Solid Waste and Management in Tripoli City—Libya. Open Journal of Ecology, 06(07), 435–442. |
| [7] | Ilyas H, Ilyas S, Rashid Ahmad S, Nawaz Ch M. Waste Generation Rate and Composition Analysis of Solid Waste in Gujranwala City Pakistan. International Journal of Waste Resources. 2017; 07(03). |
| [8] | Nadeem K, Farhan K. Waste Amount Survey and Physio-Chemical Analysis of MSW Generated in Gujranwala-Pakistan. International Journal of Waste Resources. 2016; 06(01). |
| [9] | Alam P, Mazhar MohdA, Khan AH, Khan NA, Mahmoud AED. Seasonal characterization of MSW in the city of Jammu, India. IOP Conference Series: Materials Science and Engineering. 2021; 1058(1): 012061. |
| [10] | Agrawal A, Pandey R, Agrawal ML. Seasonal variation in composition and characteristics of Indian MSW –A case study. Recent Research in Science and Technology. 2013; 5(5): 40-43. |
| [11] | Sharma DrN. Management of Solid Waste from Jaipur City; Seasonal Variation of City Waste Corporation and Features. MET Management Review. 2021; 08(02): 29-35. |
| [12] | Kalyanasundaram M, Krishnan K, Singh S, et al. Composition analysis (pick analysis) of waste generated from household: A pilot study in Ujjain city, India. Heliyon. 2023; 9(9): e19902. |
| [13] | ASTM (2008) Standard test method for determination of the composition of unprocessed MSW. D5231- 92, ASTM International, West Conshohocken. |
| [14] | Central Pollution Control Board (CPCB). (2023). Annual Report on Solid Waste Management in India (2022–23). Ministry of Environment, Forest and Climate Change. |
| [15] | Karnataka State Gazetteer: Tumkur.; 1969. |
| [16] | Chatterjee, S., Roy, S., & Mandal, B. (2022). Evaluating the seasonal dynamics of food waste and its composting potential in low-income Indian neighborhoods. Journal of Environmental Management, 315, 115114. |
| [17] | Behera, S. K., et al. (2020). Physicochemical and nutrient characteristics of municipal waste for composting. Ecological Engineering, 158, 106090. |
| [18] | Bowan PA, Tierobaar MT. Characteristics and Management of Solid Waste in Ghanaian Markets - a Study of WA Municipality. Published January 1, 2014. |
| [19] | Babaei, A., Goudarzi, G., Jaafarzadeh, N., Jalili, D., Parseh, I., & Khodadadi, R. (2019). Municipal Solid Waste characterization, quantification, and management: A case study in Shadegan International Wetland region, Iran. J Adv Environ Health Res, 7, 145–154. |
| [20] | Sharholy, M., Ahmad, K., Vaishya, R. C., & Gupta, R. D. (2015). Composting of Municipal Solid Waste. Waste Management, 29(2), 459–467. |
| [21] | Jithendra SJ, Godihal H, MM. Enhancement of composting methods in solid waste management. J Water Resour Pollut Stud. 2022; 7(3): 22-33. |
| [22] | Singh, R., et al. (2020). Seasonal variation of solid waste composition: a case study. Environmental Science and Pollution Research, 27, 14289–14300. |
| [23] | Singhal A, Gupta AK, Dubey B, Ghangrekar MM. Seasonal characterization of MSW for selecting feasible waste treatment technology for Guwahati city, India. Journal of the Air & Waste Management Association. 2021; 72(2): 147-160. |
| [24] | Aggarwal, R. K., Bhardwaj, S. K., & Brahmi, M. K. (2022). Quantification and Characterization of Urban Solid Waste and Its Ecological Accounting in Manali City of Hilly Region. International Journal of Bio-Resource and Stress Management, 13(10), 1084–1089. |
| [25] | Gupta, P., & Arora, M. (2020). Income disparity and its influence on solid waste segregation behavior in Delhi. Urban Studies Journal, 57(3), 570–588. |
| [26] | Dasgupta B, Yadav VL, Mondal MK. Seasonal characterization and present status of MSW (MSW) management in Varanasi, India. Advances in environmental research. 2013; 2(1): 51-60. |
| [27] | Noufal, M., Yuanyuan, L., Maalla, Z., & Adipah, S. (2020). Determinants of household solid waste generation and composition in Homs city, Syria. Journal of Environmental and Public Health, 2020. |
| [28] | Cheela VRS, Goel S, John M, Dubey B. Characterization of MSW based on seasonal variations, source and socio-economic aspects. Waste Disposal & Sustainable Energy. 2021; 3(4): 275-288. |
| [29] | Joseph, K., et al. (2018). Integrated solid waste management in India: Status and emerging practices. Waste Management, 78, 1–12. |
| [30] | Das, S., & Bhattacharyya, B. K. (2015). Municipal Solid Waste characteristics and management in Kolkata, India. International Journal of Emerging Technology and Advanced Engineering, 5(2), 142–150. |
| [31] | Kumar, S., Bhattacharyya, J. K., Vaidya, A. N., Chakrabarti, T., Devotta, S., & Akolkar, A. B. (2018). Assessment of the status of Municipal Solid Waste management in metro cities, state capitals, class I cities, and class II towns in India: An insight. Waste Management, 28(2), 246–263. |
| [32] | Gupta, N., Yadav, K. K., & Kumar, V. (2015). A review on current status of Municipal Solid Waste management in India. Journal of Environmental Sciences, 37, 206–217. |
| [33] | Ferronato, N., & Torretta, V. (2019). Waste management strategies in developing countries: Challenges and opportunities. Journal of Environmental Management, 240, 72–83. |
| [34] | Angadi, S. (2023). AN ASSESSMENT OF SOLID WASTE MANAGEMENT IN MANGALURU CITY, KARNATAKA: A CASE STUDY (Vol. 8, Issue 8). |
| [35] | CPCB. (2022). Annual Report on Implementation of Solid Waste Management Rules. Central Pollution Control Board, MoEFCC, Government of India. |
| [36] | Guerrero, L. A., Maas, G., & Hogland, W. (2013). Solid waste management challenges for cities in developing countries. Waste Management, 33(1), 220–232. |
| [37] | Kaza, S., Yao, L., Bhada-Tata, P., & Van Woerden, F. (2018). What a Waste 2.0: A Global Snapshot of Solid Waste Management to 2050. World Bank. |
| [38] | Han, Z., Liu, Y., Zhong, M., Shi, G., Li, Q., Zeng, D., Zang, Y., Fei, Y., Xie, Y., 2018. Influencing factors of domestic waste characteristics in rural areas of developing countries. Waste Management 72, 45–54. |
| [39] | Naveen, B. P., Mahapatra, D. M., Sitharam, T. G., Sivapullaiah, P. v., & Ramachandra, T. V. (2017). Physico-chemical and biological characterization of urban municipal landfill leachate. Environmental Pollution, 220, 1–12. |
| [40] | Sharma, R., & Jain, V. K. (2019). Evaluation of electrical conductivity and salinity of MSW compost. Waste Management & Research, 37(1), 85–91. |
| [41] | Nandan A, Yadav BP, Baksi S, Bose D. Recent Scenario of Solid Waste Management in India. World Scientific News. 2017; 66: 56-74. |
| [42] | Jha, A. K., et al. (2014). Nutrient profile of urban compost from Municipal Solid Waste. Waste Management & Research, 32(8), 726–734. |
| [43] | Rawat, M., Ramanathan, AL., & Kuriakose, T. (2013). Characterisation of Municipal Solid Waste Compost (MSWC) from Selected Indian Cities—A Case Study for Its Sustainable Utilisation. Journal of Environmental Protection, 04(02), 163–171. |
| [44] | Ghosh, P., et al. (2018). Characterization of Organic waste for composting. Waste Management, 76, 607–616. |
| [45] | Sequeira, V., & Chandrashekar, J. S. (2015). Solid Waste Management in Mangaluru City-A Case Study. In International Journal of Innovation and Applied Studies (Vol. 10, Issue 1). |
| [46] | SWACHH BHARAT MISSION MSW MANAGEMENT MANUAL. |
| [47] | Kiran D, SV Pushkara, R Jitvan, S Darshan. Characterization, quantification and management of Municipal Solid Waste in Shivamogga city, Karnataka, India. Waste Management Bulletin. 2023; 1(3): 18-26. |
| [48] | D P Angadi. A Review On Current Status Of Municipal Solid Waste Management In Karnataka State: A Geographical Study. International Journal of Advances in Engineering and Management (IJAEM). 2022; 4(217). |
APA Style
Harisha, K., Chandrashekar, J. S. (2026). Seasonal Characterization of Municipal Solid Waste for Selected Wards for Tumakuru City, Karnataka, India. International Journal of Environmental Monitoring and Analysis, 14(2), 89-100. https://doi.org/10.11648/j.ijema.20261402.13
ACS Style
Harisha, K.; Chandrashekar, J. S. Seasonal Characterization of Municipal Solid Waste for Selected Wards for Tumakuru City, Karnataka, India. Int. J. Environ. Monit. Anal. 2026, 14(2), 89-100. doi: 10.11648/j.ijema.20261402.13
@article{10.11648/j.ijema.20261402.13,
  author = {Kariyanna Harisha and Jambhava Samavedamuni Chandrashekar},
  title = {Seasonal Characterization of Municipal Solid Waste for Selected Wards for Tumakuru City, Karnataka, India},
  journal = {International Journal of Environmental Monitoring and Analysis},
  volume = {14},
  number = {2},
  pages = {89-100},
  doi = {10.11648/j.ijema.20261402.13},
  url = {https://doi.org/10.11648/j.ijema.20261402.13},
  eprint = {https://article.sciencepublishinggroup.com/pdf/10.11648.j.ijema.20261402.13},
  abstract = {One of the major issues facing in tier-II cities like Tumakuru is the Efficient implementation Of Integrated Municipal Solid Waste Management. In order to choose the best Scientific Waste Treatment Technologies and Management Strategies for Tumakuru city, the amount and Composition of Municipal Solid Waste (MSW) differ considerably over the course of three distinct seasons. In order to ascertain the average per capita waste generation in each of Tumakuru City Corporation's (TCC) thirty-five wards, household data was gathered through a survey. Waste samples from 1050 households in each of the three seasons were recorded in order to calculate the average Household generation for five wards. According to the study's findings, the total amount of waste produced by Tumakuru city's households can be estimated at 110 TPD. And the results show that MSW samples have seasonal variation in Moisture content ranging from 27.52% to 41.2%, with an average of 34.46% which is suitable for composting and Biomethanation. The Calorific value having medium energy recovery potential which is suitable for refuse derived fuel (RDF). The overall results of MSW revealed significant seasonal effects on Moisture content, TOC, and Nutrient Parameters, confirming that climatic conditions strongly influence waste characteristics.},
 year = {2026}
}
TY  - JOUR
T1  - Seasonal Characterization of Municipal Solid Waste for Selected Wards for Tumakuru City, Karnataka, India
AU  - Kariyanna Harisha
AU  - Jambhava Samavedamuni Chandrashekar
Y1  - 2026/03/30
PY  - 2026
N1  - https://doi.org/10.11648/j.ijema.20261402.13
DO  - 10.11648/j.ijema.20261402.13
T2  - International Journal of Environmental Monitoring and Analysis
JF  - International Journal of Environmental Monitoring and Analysis
JO  - International Journal of Environmental Monitoring and Analysis
SP  - 89
EP  - 100
PB  - Science Publishing Group
SN  - 2328-7667
UR  - https://doi.org/10.11648/j.ijema.20261402.13
AB  - One of the major issues facing in tier-II cities like Tumakuru is the Efficient implementation Of Integrated Municipal Solid Waste Management. In order to choose the best Scientific Waste Treatment Technologies and Management Strategies for Tumakuru city, the amount and Composition of Municipal Solid Waste (MSW) differ considerably over the course of three distinct seasons. In order to ascertain the average per capita waste generation in each of Tumakuru City Corporation's (TCC) thirty-five wards, household data was gathered through a survey. Waste samples from 1050 households in each of the three seasons were recorded in order to calculate the average Household generation for five wards. According to the study's findings, the total amount of waste produced by Tumakuru city's households can be estimated at 110 TPD. And the results show that MSW samples have seasonal variation in Moisture content ranging from 27.52% to 41.2%, with an average of 34.46% which is suitable for composting and Biomethanation. The Calorific value having medium energy recovery potential which is suitable for refuse derived fuel (RDF). The overall results of MSW revealed significant seasonal effects on Moisture content, TOC, and Nutrient Parameters, confirming that climatic conditions strongly influence waste characteristics.
VL  - 14
IS  - 2
ER  -
Department of Studies and Research in Environmental Science, Karnataka State Open University, Mysuru, Karnataka
Department of Studies and Research in Environmental Science, Karnataka State Open University, Mysuru, Karnataka